Applied Materials (AMAT) Executive Summary: The End of the Bull Run? Why AMAT Just Became a "Wait and See"
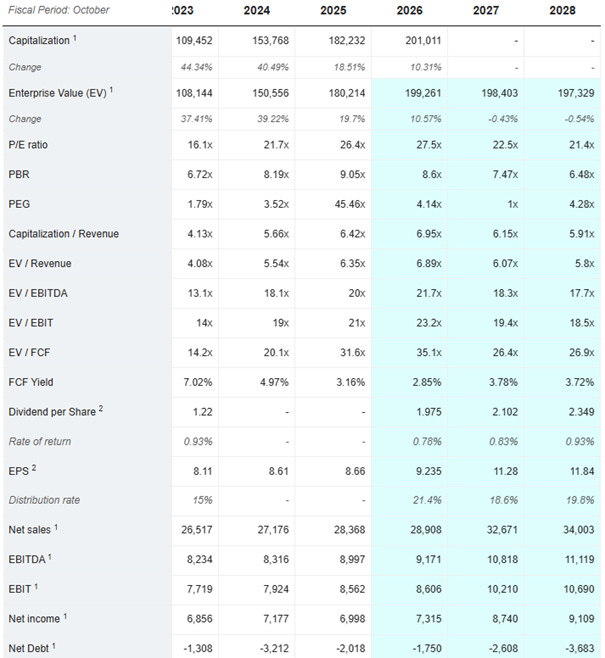
The China restrictions are having broader knock-on effects. Valuation isn't compelling for a cyclical at peak. You're paying roughly 26x-27.5x forward earnings for a company facing headwinds.

Company Overview
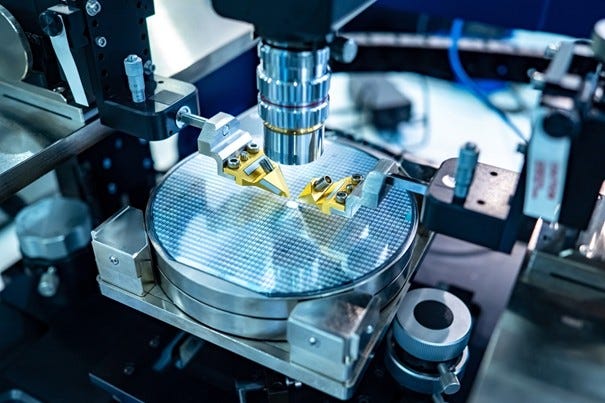
Applied Materials, headquartered in Santa Clara, California and founded in 1967, is a critical player in the production of semiconductors, providing equipment that facilitates various steps in the manufacturing process, including etching, deposition, and wafer inspection. Applied Materials operates in two main segments: Semiconductor Systems and Applied Global Services (AGS).
The Semiconductor Systems segment includes advanced technologies used in chip fabrication, such as rapid thermal processing, chemical vapor deposition, and metrology. This segment serves markets including foundry, logic, DRAM, and NAND memory.
Applied Global Services offers solutions to optimize the performance of semiconductor equipment and includes services like upgrades, spares, and factory automation software.
The company has a significant presence in key global markets, including the United States, China, Korea, Taiwan, and Japan.
Business Model Strengths and Risks
Strengths:
Leader in semiconductor equipment with comprehensive product portfolio
AI tailwind: Data center buildout drives demand for advanced chips
Oligopoly market structure: Few competitors can match their scale
Strong moat in materials engineering expertise
Weaknesses/Risks:
Customer concentration: 2 customers = 34% of revenue (likely TSMC and Samsung/Intel)
Geographic concentration: Heavy Asia exposure (especially China/Taiwan)
Export control vulnerability: US restrictions directly reduce addressable market
Cyclical industry: Semis are notoriously boom-bust
Price Action & Technical Context
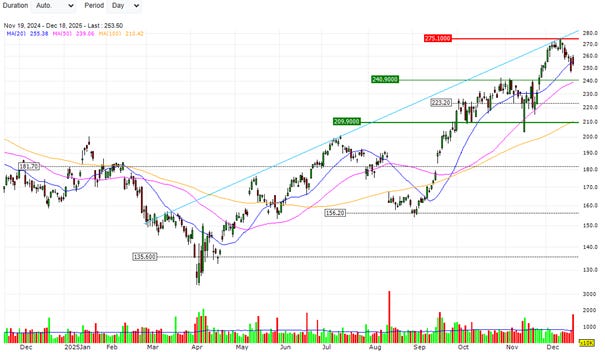
Looking at your chart and the price data, Applied Materials made a strong run from September lows around $170 to peak at $276 on December 10th, then got sharply rejected. Currently trading at $253.50 (down ~8% from the high in just 8 trading days).
Price is now testing the 50-day SMA area (shown in blue on the chart)
Volume has been elevated during the decline, suggesting distribution
The rejection at $276 is significant, that’s roughly the highest level since early 2024, and the failure to hold suggests institutional profit-taking or repositioning.
Fundamental Health: Strong but Decelerating
Recent Earnings (Q4 FY2025, reported Nov 13):
EPS: $2.17 (vs. est. $2.10): Beat by 3.3%
Revenue: $6.80B (vs. est. $6.67B) : Beat
But guidance disappointed: Q1 outlook of $6.35B-$7.35B (midpoint $6.85B vs. $6.76B est.)
The Problem: Q4 marked the first quarterly revenue decline in recent quarters (down 3.5% YoY), and guidance suggests continued headwinds. Management cited:
China export restrictions impacting $600M in FY2026 revenue
Uncertainty around equipment demand timing
Year-over-Year Earnings Trends:
Q4’25: $2.17 vs. Q4’24 $2.32 = -6.5% decline
However, full-year still showed growth with consistent beats
The company is profitable and generating strong cash flow, but the growth trajectory is flattening.
The China problem: Material Revenue Risk
Export Restrictions Impact:
BIS Affiliates Rule (announced Oct 2, 2025) expected to reduce Q4 revenue by $110M and FY2026 revenue by $600M
Applied Materials disclosed this after market close, causing an immediate stock drop
These restrictions give competitive advantage to foreign equipment makers who aren’t subject to US export controls
China Revenue Exposure:
While exact China revenue percentage isn’t disclosed in the data, news mentions and analyst commentary suggest it’s substantial
Chinese government has sued Applied Materials for alleged trade secret theft (likely retaliatory)
China implementing export controls on rare earth minerals used in Applied Materials products
The geopolitical chess game is accelerating, and Applied Materials is caught in the middle. This creates significant unpredictability in their business model.
Analyst Sentiment: Recently Bullish but Cautious
Recent Upgrades:
Jefferies (Dec 15): Raised PT to $360 (from $260): Most bullish
Wells Fargo (Dec 15): Raised PT to $290
UBS (Nov 25): Upgraded to Buy, PT $285
However:
Multiple downgrades occurred in Aug-Sep when stock was weaker
Morgan Stanley notably downgraded to Sell in December 2024 (PT $164), though later upgraded back
Bank of America downgraded to Neutral in August 2025 citing headwinds
Consensus seems to be: Strong long-term AI/semiconductor story, but near-term China headwinds create uncertainty. Price targets range from $164 to $360: Massive dispersion signals high uncertainty.
Insider & Institutional Activity
Insiders:
CEO Gary Dickerson sold $98.6M in June 2024 and has been receiving large stock awards
SVP Teri Little has been selling regularly (most recently Dec at $250+)
Pattern suggests routine selling, but timing near highs is notable
Congressional Trading:
Heavy bipartisan activity, with Rep. Ro Khanna (D) and Marjorie Taylor Greene (R) both actively buying
Senator Ashley Moody (R) made large purchases ($100K-$250K) in January 2025
Smart Money Seems Conflicted: Insiders selling while politicians buying. Options flow shows both bullish and bearish positioning with elevated put activity recently.
The Selloff Might be Justified
The $600M China revenue hit is not priced in adequately. That’s roughly 8-9% of annual revenue being taken off the table. Stock is only down 8% from peak.
Q4 revenue decline (-6.5% YoY) while AI is supposedly booming? This suggests either:
Lead customers are over-inventoried on equipment
Equipment spending is shifting to areas where Applied Materials has less share
The China restrictions are having broader knock-on effects
Valuation isn’t compelling for a cyclical at peak. You’re paying roughly 26-27.5x forward earnings for a company facing headwinds.
Geopolitical risk is escalating, not declining. The China-US tech war is intensifying, and Applied Materials is a prime target.
Bottom Line
Applied Materials currently finds itself in a precarious “show-me” phase, where its reputation as a high-quality semiconductor leader is being tested by a deteriorating macro environment. The recent technical breakdown from the $276 level was a fundamental shift fueled by the company’s first quarterly revenue decline in years and increasingly murky forward guidance. For investors, the message is clear: The era of blind dip-buying in Applied Materials is over as the market begins to price in a more complex growth trajectory.
The headwinds are largely geopolitical and structural rather than just cyclical. Material export restrictions to China remain a significant drag on the bottom line, leaving a hole that has yet to be filled by other markets. Coupled with elevated geopolitical tensions and a lack of clarity on near-term equipment demand, the stock is searching for a floor. Before considering a new position, we need to see evidence that lead customers are ready to accelerate orders again and a definitive answer on how much of that lost China revenue can truly be replaced.
From a technical perspective, the chart suggests patience is the most profitable virtue. While the $245–$250 range (the 50-day SMA) offers immediate interest, the more substantial “margin of safety” levels sit at $230 and the $200–$210 zone, which aligns with anchored VWAP and historical resistance-turned-support. Ideally, we want to see Applied Materials move sideways to build a solid base below $250 rather than a sharp, volatile bounce. Waiting for this stabilization ensures we aren’t catching a falling knife driven by macro forces beyond the company’s control.
Disclaimer: This content is for informational purposes only and does not constitute financial advice. All opinions expressed are my personal views. Always do your own research and consult with qualified professionals before making investment decisions.
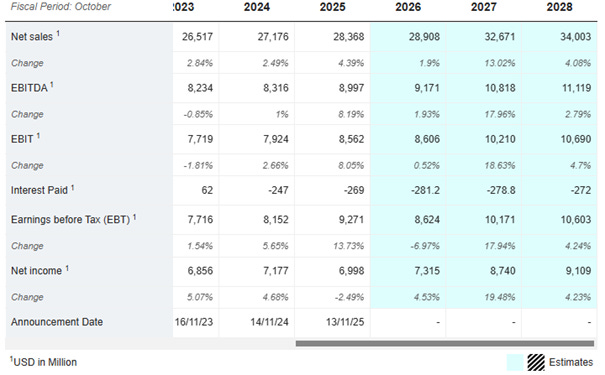
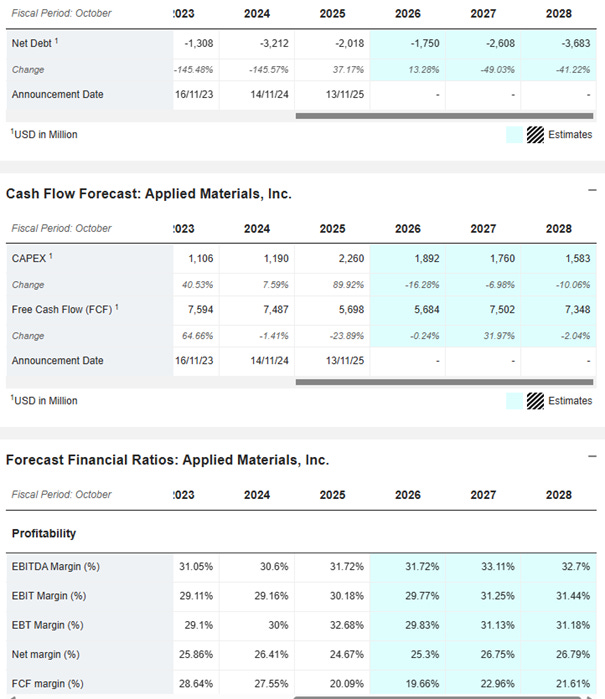
Appendix 1: Financial Projections
Appendix 2: Valuation Metrics