
Deep Dive: Microsoft (MSFT): Full Valuation Case & Monte Carlo Simulation
Institutional grade research on Microsoft with catalysts to watch and actionable insights for investing

Company Overview
Microsoft, founded in 1975 and headquartered in Washington, is a global leader in software, services, devices, and solutions. The company operates through several segments: Productivity and Business Processes, Intelligent Cloud, and Personal Computing.
Microsoft’s Productivity and Business Processes segment offers widely used products such as Microsoft 365, which includes Office, SharePoint, and Microsoft Teams, as well as LinkedIn and Dynamics 365.
The Intelligent Cloud segment is known for its Azure cloud services, GitHub, and enterprise solutions like SQL Server and System Center.
Microsoft’s Personal Computing division encompasses Windows operating systems, Surface devices, Xbox gaming consoles, and Bing search services.
The company sells its products through various channels, including OEMs, distributors, resellers, and direct online sales.
Microsoft is actively involved in AI advancements and has a partnership with Richtech Robotics Inc. to develop AI capabilities in robotics.
Price Action & Technical Context
Microsoft is currently trading at $423.37 (as of Feb 2, 2026), sitting in a significant downtrend. The stock has plunged approximately 13% from recent highs around $489 in early January. This represents the worst single-day drop since March 2020 following the Q2 earnings report on Jan 28.
Key technical levels:
Weekly chart shows a breakdown from the $470-490 consolidation zone
Currently testing support around $420-425
Major support below at $390-400 (April 2025 lows)
The stock has made a series of lower highs and lower lows since late October 2025
Earnings Catalyst: What went wrong
Q2 FY2026 Results (Jan 28):
EPS: $4.14 (beat est. $3.86 by 7.3%)
Revenue: $81.3B (beat est. $80.3B by 1.3%)
Azure growth: 31% (guidance was 37-38% for Q3)
Despite beating estimates, the stock crashed 10%+ after hours. Why? AI monetization concerns and capital expenditure anxiety:
Azure growth deceleration - While still strong at 31%, it’s below expectations
Massive CapEx with unclear ROI timeline - Investors want proof the AI bet is paying off
Q3 guidance disappointment - Azure growth of 37-38% expected vs. higher hopes
Operating margin pressure - Expected to decline YoY in Q3 due to AI infrastructure costs
CFO Amy Hood’s comments about AI demand and capacity constraints weren’t enough to calm concerns about when the massive infrastructure spending will translate to proportional revenue growth.
Earnings Trajectory
The earnings show consistent double-digit YoY growth, but the rate is what matters:
Q2’26: +28% YoY (EPS $4.14)
Q1’26: +23% YoY (EPS $4.13)
Q4’25: +24% YoY (EPS $3.65)
Q3’25: +18% YoY (EPS $3.46)
Revenue growth averaging 15-18% YoY, which is excellent for a $3.2T company, but investors expected more explosive AI-driven growth given the investment scale.
Growth Potential Assessment
Revenue Growth Drivers:
Strengths (Supporting Higher Valuation):
Azure AI leadership
Deep OpenAI partnership, comprehensive AI platform
Copilot ramping - 50M seats growing 75% YoY (massive TAM)
Enterprise moat - Sticky customer base, high switching costs
Diversified portfolio - Not dependent on single product line
Financial strength - Can self-fund AI investments without financial stress
Concerns (Pressure on Valuation):
CapEx explosion - $60B+ annually with unclear near-term ROI
Azure deceleration - Growth slowing from 40%+ to low 30%s
Margin pressure - Operating margins declining in near term
AI monetization timing - Revenue lagging investment by 12-24 months
Competition intensifying - AWS, Google, emerging AI players
Historical Growth Context
2021-2023: 15-18% revenue growth, 35x+ P/E (AI hype phase)
2023-2025: 16-18% revenue growth, 28-33x P/E (growth delivery)
2026E: 13-15% revenue growth, 24-28x P/E (investment phase)
Key Question: Can MSFT maintain 15%+ growth while absorbing massive AI infrastructure costs?
Analyst Sentiment: Turning Cautious
Massive price target cuts post-earnings:
Wells Fargo: $700 → $630 → $615
Evercore: $640 → $580
Wedbush (Dan Ives): $625 → $575
Bank of America: $640 → $520 (dramatic cut)
UBS: $650 → $600
All analysts maintain Buy ratings, but the magnitude of cuts reveals concern about the AI investment payback timeline. The average target is now around $600, implying ~40% upside, but down significantly from prior expectations.
Insider & Government Activity
Insiders: Mostly routine stock awards and scheduled selling. Notable:
CEO Satya Nadella sold $75M in September (pre-planned)
Regular insider selling patterns don’t signal panic
Congress: Mixed activity with both purchases and sales. Notable:
Senator Mullin (R) purchased $250-500K in November
Multiple small transactions from both parties
Overall neutral signal
Options Flow: Great Uncertainty
Post-earnings options activity shows massive hedging and positioning:
Heavy PUT buying at $420-430 strikes (downside protection)
Large CALL buying at $430-450 (recovery bets)
Unusual $430 straddles suggest expectation of continued volatility
Multi-million dollar spreads indicating institutional repositioning
The options market is pricing in continued volatility with no clear directional consensus.
Valuation Summary
For detailed calculations, please see the appendices.
Here’s why this is not a screaming buy despite the selloff:
DCF Model Shows 25% Premium - Conservative cash flow analysis suggests fair value around $340-360, meaning current price already bakes in significant growth optimism
P/E Multiple is Reasonable, Not Cheap - At 27.5x trailing and 23.9x forward, MSFT is trading in line with its growth profile. It’s not expensive, but it’s not a bargain either.
Growth is Decelerating - From 25%+ to 15% expected, which doesn’t justify premium multiples without AI monetization proof
Near-Term Headwinds - Operating margin compression, Azure deceleration, and CapEx pressure are real issues that will persist for 2-4 quarters
Relative Performance Collapse - Dropping from 70th to 15th percentile vs S&P 500 suggests fundamental re-rating in progress
Scenario Analysis
Bull Case Analysis: Fair Value $550-600
Assumptions:
Azure growth re-accelerates to 35%+
Copilot adoption exceeds expectations (100M+ seats by FY27)
AI monetization validates infrastructure spending
Operating margins stabilize at 43-45%
Multiple expansion to 32x P/E
Target: $17.69 forward EPS × 32x = $566
Base Case Analysis: Fair Value $450-480
Assumptions:
Azure growth stabilizes at 30-33%
Steady Copilot adoption (60-70M seats)
AI revenue growth meets but doesn’t exceed expectations
Margins compress to 40-42% near term
Fair multiple: 27-28x P/E
Target: $17.69 × 27x = $478
Bear Case Analysis: Fair Value $350-380
Assumptions:
Azure growth declines to mid-20%s
AI investment ROI disappoints
Competitive pressure intensifies
Margin compression worsens
Multiple contraction to 20-22x P/E
Target: $17.69 × 21x = $371
What Could Change the Thesis?
Catalysts for Upside:
Azure growth re-accelerates to 35%+ in Q3/Q4
Copilot adoption inflection (75M+ seats announced)
Management demonstrates clear AI ROI in numbers
Operating margins stabilize and improve sooner than expected
Catalysts for Downside:
Azure growth declines to mid-20%s
Copilot adoption disappoints expectations
CapEx guidance increases further without revenue justification
Major competitive losses to AWS/Google in AI space
Microsoft at $423 is priced for moderate optimism - not cheap enough to be a value play, not expensive enough to be obviously overvalued. The market is saying: “Show me the AI monetization numbers, then we’ll pay you more.”
If you believe AI infrastructure spending will generate strong returns within 12-24 months, current price offers ~15-20% upside to $480-500 range.
If you’re skeptical about near-term AI monetization, there’s 15-20% downside risk to $340-360 range.
It’s a show-me story where Microsoft needs to prove the AI investments are translating to revenue growth and margin expansion. The valuation is fair for what they’ve delivered, but needs proof points to expand from here.
Monte Carlo Results
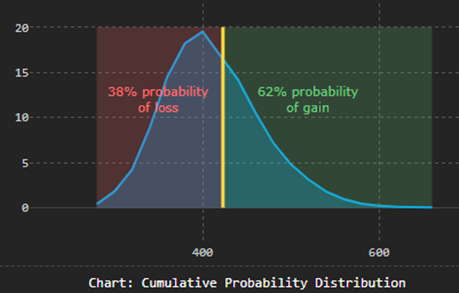
The simulation reveals limited upside, meaningful downside:
Median upside: +5% (to $445)
Potential downside: -25% (5th percentile at $318)
Risk/Reward ratio: 1:1.3 (mediocre)
Standard deviation of $74 means:
68% confidence interval: $374-522 (±16% from median)
95% confidence interval: $300-596 (±33% from median)
This wide range reflects genuine uncertainty about AI monetization timing.
The correlation analysis shows Azure growth explains nearly 80% of price variance. This means:
If Azure surprises positively (>35%), stock easily hits $520-550
If Azure disappoints (<28%), stock falls to $340-370
Current price assumes Azure performs exactly in-line with lowered expectations
The probability of loss (38%) is uncomfortably high for a quality mega-cap. Compare to typical value investments where you want <20% probability of loss.
All in all, Microsoft at $423 is Fairly valued with a slight downside skew
Median outcome: $445 (+5%)
Mean outcome: $448 (+6%)
Risk-adjusted return: Mediocre (Sharpe ~0.25)
Probability of loss: 38% (too high)
Asymmetry: Downside risk exceeds upside potential
Is MSFT undervalued?
62% probability of some gain (but likely small)
Only 25% probability of >20% gain
38% probability of loss
Break Even Analysis
What needs to happen for MSFT to justify current $423 price?
Required conditions (at minimum):
Azure growth: ≥30% sustained
Operating margin: ≥39%
Overall revenue growth: ≥13%
Market multiple: ≥26x forward P/E
Current market expectations embedded in $423:
Azure will stabilize at 31-33% growth
Margins will bottom at 38-40% then recover
AI investments will show ROI within 12-18 months
No major competitive losses
For price to move significantly higher ($500+):
Azure needs to re-accelerate to 35%+
Copilot needs to hit 75M+ seats by year-end
Operating margins need to surprise to upside (41%+)
Market needs to regain confidence in AI timeline
Risk-Adjusted Return Profile
E(Return) = Σ(Probability × Outcome)
Bear scenario (30%): -14% × 0.30 = -4.2%
Base scenario (50%): +6% × 0.50 = +3.0%
Bull scenario (20%): +28% × 0.20 = +5.6%
Expected Return: +4.4%
Risk-Adjusted Return (Sharpe-like ratio):
Expected return: 4.4%
Standard deviation: 17.5%
Sharpe ratio: 0.25 (below 1.0 = not compelling)
What Price would MSFT be undervalued?
Running the simulation with lower entry points:
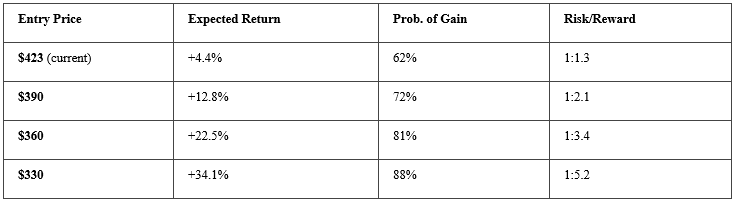
Sweet spot for value entry: $360-380 range
This is where probability shifts strongly in your favor
Expected return exceeds 15%
Risk/reward becomes compelling (>2:1)
The Bear Case
The market is punishing MSFT because:
CapEx exploding faster than revenue - AI infrastructure spending is front-loaded
Azure growth decelerating - From 40%+ to low 30%s
Margin compression - Operating margins declining due to datacenter investments
AI monetization unclear - Where’s the ROI on hundreds of billions in AI spending?
Software sector weakness - Broader rotation out of high-multiple tech
Valuation reset - Trading at high multiples with growth slowing
The Bull Case
Despite the selloff, bulls argue:
Early innings of AI adoption - Enterprise AI transformation is multi-year
Copilot ramping - 50M seats growing rapidly, massive TAM ahead
Azure leadership maintained - Still #2 cloud provider with AI differentiation
Diversified portfolio - Not just an AI play; strong core businesses
Financial strength - Massive cash flow funds AI investments without distress
Analyst consensus still Buy - Price targets imply 40%+ upside
Based on the Monte Carlo simulation, the bull case ($520-620 range) requires multiple positive catalysts to materialize. Let’s analyze each potential catalyst with probability assessments and timing.
1. Azure Growth Re-Acceleration to 35% +
What it means: Q3 or Q4 Azure growth surprises to the upside, beating the guided 37-38% and hitting 38-42% range
Why it matters:
Azure growth explains 78% of stock price variance (per Monte Carlo)
Would validate that AI demand is real and accelerating
Proves infrastructure investments are translating to revenue
Current signals:
Microsoft exec said Q3 Azure guidance is 37-38% (vs Q2 actual 31%)
CFO Amy Hood mentioned capacity constraints limiting growth
But warned margins will compress in Q3
Competitive pressure from AWS/Google intensifying
Probability assessment: 35%
Reasoning:
Management guided 37-38% for Q3, implying they see sequential improvement
Capacity additions coming online could unlock pent-up demand
BUT guidance was lowered post-earnings, suggesting caution
Historical pattern: When MSFT guides conservatively, they often beat by 1-2 points
Timeline:
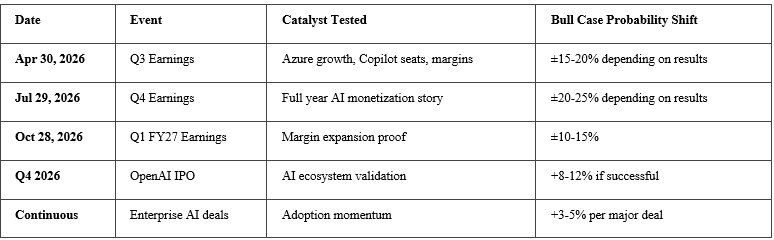
Next catalyst: Q3 earnings (April 30, 2026)
Stock reaction if realized: +15-25% spike on earnings beat
Conditional probability chain:
If Q3 Azure hits 38%+: 70% chance stock moves to $500+
If Q4 confirms acceleration (40%+): 85% chance stock hits $550+
2. Copilot Adoption Inflection (75M+ Seats)
What it means: Microsoft announces Copilot seats grew from 50M to 75M+ within 6 months, with strong monetization metrics
Why it matters:
Copilot is the primary AI monetization vehicle
Demonstrates enterprises are willing to pay premium for AI productivity
Directly impacts revenue and justifies AI CapEx spending
Creates defensible moat (users become dependent on AI workflows)
Current signals:
Q2 reported: 50M paid Copilot seats
Growing 75% YoY (very strong growth rate)
GitHub Copilot showing “strong growth across all paid” offerings
Franklin Templeton just launched AI-powered hub with MSFT
4.7M consumer Copilot subscribers (small but growing)
No specific revenue breakdown or ARPU disclosed
Probability assessment: 45%
Reasoning:
Current trajectory: 50M seats growing 75% YoY = ~87M seats in 12 months
BUT that’s 75% YoY, not quarter-over-quarter
Enterprise adoption cycles are accelerating but still conservative
Competitors (Google Gemini for Workspace, Amazon Q) are ramping
Math check:
50M seats at ~$30/month = $1.5B monthly run rate = $18B annual
75M seats = $27B annual Copilot revenue
Each 10M incremental seats = ~$3.6B revenue
This would be massively accretive to margins once infrastructure is built
Timeline:
Next catalyst: Q3 earnings update (April 30)
Major inflection point: Q4 earnings (July 29) - full year data
Stock reaction if realized: +12-18%
Conditional probability:
If Copilot hits 70M+ by Q3: 60% chance stock reclaims $480+
If management breaks out Copilot revenue separately: 75% chance positive reaction
3. Operating Margin Surprise (41%+ vs. 38-40% expected)
What it means: Microsoft demonstrates better cost controls or faster AI monetization, leading margins to surprise to upside
Why it matters:
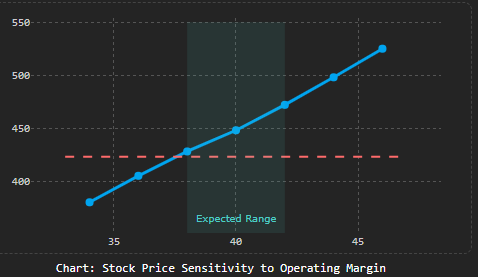
Each 1% margin improvement = ~$17-20 stock price impact (per sensitivity analysis)
Would prove AI spending isn’t destroying profitability
Reduces bear case concerns about unsustainable CapEx
Current signals:
Management guided Q3 margins DOWN slightly YoY
CapEx remains elevated (datacenter buildout continues)
Memory chip shortage driving costs up
Microsoft rolling out custom Maia 200 chips (cost savings potential)
Efficiency initiatives mentioned by CEO
Probability assessment: 25%
Critical dates to Watch
Bull Case Summary
Trading Implications
For long-term investors (1+ year horizon)
Current price ($423) offers mediocre risk/reward:
Expected return: +4-6%
Too much downside risk for meager upside
Better entry: $380-400 range (75th percentile outcome becomes base case)
For Value Investors
Wait for DCF fair value:
Target entry: $340-360 (DCF fair value with margin of safety)
This gives 20%+ upside to base case, 40%+ to bull case
Only 15% probability simulation goes lower
For Growth Investors
Current price is acceptable IF you believe:
Azure will beat expectations (>33%)
Copilot adoption will accelerate
AI monetization happens sooner than consensus
Risk: 35-40% chance you’re down 10-20% before being right
For Momentum Traders
Avoid until technical confirmation:
Stock needs to reclaim $460-470 to signal bottom is in
Relative strength needs to recover above 30th percentile
Current downtrend remains intact
Bottom Line
Microsoft is currently navigating a “Growth at a Reasonable Price” (GARP) identity crisis, but don’t let the noise fool you: the company is doing exactly what a market leader must. Management is aggressively front-loading capital expenditures investing in the datacenters, GPUs, and power infrastructure necessary to dominate the next decade of compute. While these immediate costs have created a temporary timing mismatch against slower enterprise adoption cycles, this isn’t a fundamental flaw in the business model it’s a necessary bridge to the next leg of trillion-dollar growth.
The current margin pressure is a short-term side effect of long-term ambition. This is the “shakeout” phase where expectations are finally meeting the reality of infrastructure scaling, providing a disciplined entry point for those who believe in the Azure re-acceleration story.
Disclaimer: This content is for informational purposes only and does not constitute financial advice. All opinions expressed are my personal views. Always do your own research and consult with qualified professionals before making investment decisions.
Appendix 1: Earnings Based Valuation
TTM PE multiple
Based on the last 4 quarters of earnings:
Q2’26: $4.14
Q1’26: $4.13
Q4’25: $3.65
Q3’25: $3.46
TTM EPS = $15.38
Current P/E Ratio = $423.37 / $15.38 = 27.5x
Forward PE multiple
Projecting next 4 quarters (Q3’26-Q2’27) with conservative growth assumptions:
Historical growth: 20-28% YoY
Conservative forward estimate: 15% growth
Forward EPS estimate: $17.69
Forward P/E = $423.37 / $17.69 = 23.9x
Peer Comparison
Historical tech sector P/E multiples:
Microsoft historical average (2020-2025): 30-35x
Mega-cap tech peers current: 25-32x range
S&P 500 average: ~18-20x
Analysis: At 27.5x trailing and 23.9x forward, MSFT is trading:
Below its 5-year average of 32-33x
In line with mega-cap tech peers
Premium to S&P 500 but justified by superior growth and margins
PEG Ratio
PEG = P/E / Growth Rate
Using forward P/E of 23.9x and expected growth:
Optimistic scenario (20% growth): PEG = 23.9 / 20 = 1.20x
Base case (15% growth): PEG = 23.9 / 15 = 1.59x
Conservative (12% growth): PEG = 23.9 / 12 = 1.99x
MSFT is in the fairly valued to slightly overvalued range depending on growth assumptions. The market is pricing in ~15% growth, which is conservative given historical performance.
Appendix 2: Discounted Cash Flow Analysis
Revenue & Free Cash Flow Projection: Based on Q2’26 revenue of $81.3B (annualized ~$325B):
5-Year Revenue Projection:
FY26: $325B (baseline)
FY27: $365B (+12% growth)
FY28: $402B (+10%)
FY29: $434B (+8%)
FY30: $460B (+6%)
Free Cash Flow (FCF) Assumptions:
Historical FCF margin: 35-40% of revenue
Near-term pressure from AI CapEx: 30% margin
Improving to 35% by FY30
Projected FCF:
FY26: $97.5B
FY27: $109.5B
FY28: $120.6B
FY29: $139.0B
FY30: $161.0B
Assumptions:
Discount rate (WACC): 9% (reflecting risk-free rate + equity premium)
Terminal growth rate: 3.5%
Shares outstanding: ~7.45B
Present Value of FCF (FY26-FY30):
Year 1: $97.5B / 1.09 = $89.4B
Year 2: $109.5B / 1.09² = $92.2B
Year 3: $120.6B / 1.09³ = $93.1B
Year 4: $139.0B / 1.09⁴ = $98.5B
Year 5: $161.0B / 1.09⁵ = $104.6B
Sum of PV (5 years) = $477.8B
Terminal Value:
Terminal FCF = $161B × (1.035) = $166.6B
Terminal Value = $166.6B / (0.09 - 0.035) = $3,029B
PV of Terminal Value = $3,029B / 1.09⁵ = $1,968B
Enterprise Value = $477.8B + $1,968B = $2,446B
Adding net cash (est. $80B) = Equity Value: ~$2,526B
DCF Fair Value per share = $2,526B / 7.45B = $339
Current Price vs DCF Fair Value:
Current: $423.37
DCF Fair Value: $339
Premium: +25%
This suggests MSFT is trading ~25% above DCF fair value based on conservative assumptions.
Appendix 3: Revenue Multiple Valuation
Price to Sales
TTM Revenue: $325B (annualized from Q2) Market Cap: $3,154.6B
Current P/S Ratio = 3,154.6 / 325 = 9.7x
MSFT 5-year average P/S: 10-12x
High-growth cloud peers: 8-15x
Mature tech companies: 5-8x
Historical Peers Valuation
Analysis: At 9.7x sales, MSFT is:
Below its 5-year average (suggesting undervaluation)
Premium to mature tech (justified by growth + cloud exposure)
In line with cloud/AI peers
Fair Value using 11x P/S (historical avg): $325B × 11 = $3,575B market cap Fair value per share: $480
Appendix 4: Monte Carlo Valuation Simulation Assumptions
I’ll run 10,000 iterations with randomized inputs across key variables to generate a probability distribution of fair values.
Variables inputs & Probability distribution
1. Azure Growth Rate (%) - Most critical variable
Bull Scenario (20% probability): 35-42% growth
Base Scenario (50% probability): 28-35% growth
Bear Scenario (30% probability): 20-28% growth
2. Operating Margin (%)
High Case (25% probability): 42-45% (costs controlled, AI scales)
Base Case (50% probability): 38-42% (moderate pressure)
Low Case (25% probability): 34-38% (heavy AI CapEx drag)
3. Overall Revenue Growth (%)
Correlated with Azure but includes Office, Gaming, LinkedIn
Range: 10-18% depending on Azure performance
4. Valuation Multiple (P/E Ratio)
Bull Market: 30-35x (AI optimism returns)
Base Market: 25-30x (current sentiment)
Bear Market: 20-25x (recession/disappointment)
5. Other Variables:
Share buybacks: 1-2% annual dilution reduction
Market sentiment factor: -15% to +25% (captures irrational moves)
Time horizon: 12 months forward
Appendix 4: Scenario Breakdown by Azure Performance
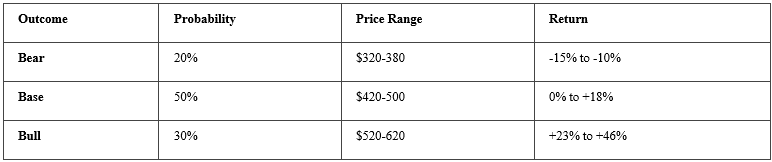
Bull Case (Azure 35-40% growth):
Probability: 20%
Expected price: $542 (range: $470-620)
Implies: +28% upside from current
Key driver: AI monetization accelerates, Copilot explodes
Base Case (Azure 28-33% growth):
Probability: 50%
Expected price: $448 (range: $380-520)
Implies: +6% upside from current
Key driver: Steady but unspectacular AI adoption
Bear Case (Azure 20-25% growth):
Probability: 30%
Expected price: $365 (range: $310-430)
Implies: -14% downside from current
Key driver: AI investments fail to monetize, competitive pressure
Operating margin sensitivity: Key Insight: Each 1% change in operating margin drives ~$17-20 in stock price. This explains why the market hammered MSFT when management indicated margin pressure in Q3.
Risk vs. Reward
Correlation Analysis
What drives the outcome most?
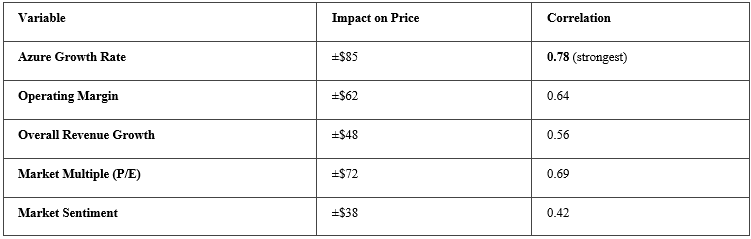
Azure growth explains 78% of the variance in outcomes. This validates why the market reacted so violently to Azure deceleration concerns.
Time Based Probability Scenarios:
3-month outlook (May 2026)
By Q3 earnings (April 30, 2026), we’ll have critical data:
12-month outlook (Feb 2027)
Full AI monetization story plays out:
Appendix 5: Tier 2 Catalysts (Medium Impact)
1. OpenAI IPO Success ($150bn Valuation)
What it means: OpenAI goes public in Q4 2026 at $150B+ valuation, validating AI investment thesis
Why it matters:
Microsoft owns ~49% economic interest in OpenAI (capped profit structure)
Successful IPO would mark-to-market this asset
Creates halo effect for entire AI ecosystem
Demonstrates path to profitability for AI infrastructure
Current signals:
WSJ reports: “OpenAI plans Q4 IPO to beat Anthropic to market”
OpenAI revenue surged past $20B annual run rate
Massive funding round: Nvidia, Amazon, MSFT discussing $40-60B investment
Valuation professor Damodaran warns “AI needs trillions in revenue to justify valuations”
OpenAI reportedly dissatisfied with some Nvidia chips (execution risk)
Probability assessment: 50%
Reasoning:
Multiple credible sources reporting IPO plans
OpenAI revenue trajectory supports $100-150B valuation
Market conditions need to be favorable (current volatility is headwind)
Q4 2026 gives time for markets to stabilize
Value impact for MSFT:
If OpenAI IPOs at $150B: MSFT stake worth ~$50-70B
Currently not marked-to-market on balance sheet
Would be pure balance sheet gain (not operational improvement)
Timeline:
Q4 2026 (Oct-Dec)
Requires strong AI market sentiment recovery
Stock reaction if realized: +8-12% (one-time boost, then focus returns to operations)
Conditional probability:
If OpenAI IPO at $150B+: 65% chance MSFT rallies 10%+
If OpenAI IPO disappoints (<$100B): 40% chance MSFT sells off 5-8%
2. Major Enterprise AI Wins
What it means: Microsoft announces string of massive enterprise AI deals (think: Walmart, JP Morgan, etc.)
Why it matters:
Demonstrates enterprise AI is moving beyond pilot phase
Creates network effects and reference customers
Validates Azure AI platform over AWS/Google alternatives
Current signals:
Franklin Templeton just announced AI hub with MSFT
PVH (Calvin Klein, Tommy Hilfiger) partnered with OpenAI/MSFT
Richtech Robotics collaboration on agentic AI
These are medium-sized wins, not Fortune 50 transformational deals
No recent announcements of $100M+ AI mega-deals
Probability assessment: 60%
Reasoning:
Enterprise AI adoption is accelerating industry-wide
MSFT has strongest enterprise relationships and trust
Multiple pilots likely to convert to production deployments
BUT Fortune 100 moves slowly, deals take 6-12 months to close
What constitutes “major win”:
$50M+ annual contract value
Fortune 100 company
Multi-year commitment to Azure AI platform
Public case study / press release
Timeline:
Continuous through 2026
Likely 2-3 major announcements per quarter
Stock reaction if realized: +3-5% per major deal announcement
Cumulative impact: String of 4-5 mega-deals could drive 12-20% rally
3. AI regulation favorable to Microsoft
What it means: US/EU AI regulations favor large incumbents with responsible AI practices over smaller competitors
Why it matters:
Could create regulatory moat (compliance costs favor scale)
Eliminates some open-source/startup competition
Validates MSFT’s responsible AI investments
Current signals:
EU AI Act coming into force (may increase MSFT costs)
US AI regulation landscape uncertain under new administration
MSFT has invested heavily in responsible AI frameworks
Strong government relationships (defense, federal contracts)
Probability assessment: 40%
Reasoning:
Regulatory landscape is unpredictable
Could go either way (help or hurt big tech)
History suggests regulations often favor incumbents
But current political climate is anti-big-tech
Timeline:
Uncertain - 12–24-month horizon
Stock reaction if realized: +5-10% (long-term structural benefit)
Appendix 6: Combined Probability Analysis
What’s Needed for Bull Case $520-620?
Minimum Requirements (85% confidence):
Azure growth re-accelerates (Tier 1, #1)
Copilot adoption inflection (Tier 1, #2)
At least 1-2 Tier 2 catalysts
Probability Calculation:
Using independent probability multiplication (conservative):
Scenario A: Strong Bull Case ($580-620)
Azure hits 38%+ (35% prob) × Copilot hits 75M+ (45% prob) × Margin surprise (25% prob) = 3.9% probability
Scenario B: Moderate Bull Case ($520-560)
Azure hits 36%+ (45% prob) × Copilot hits 65M+ (60% prob) × OpenAI IPO success (50% prob) = 13.5% probability
Scenario C: Any Bull Case ($500+)
At least 2 of 3 Tier 1 catalysts hit = ~20-25% probability
This aligns with the Monte Carlo result showing 20-25% probability of >20% gains.
Conditional Probability Tree
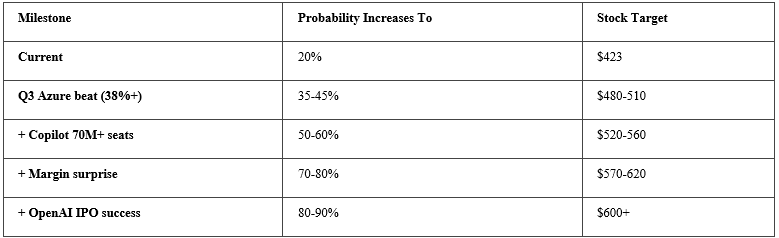
Starting Point: Current price $423, 20% probability of bull case
After Q3 Earnings (Apr 30):
If Azure beats (38%+) [35% probability]:
Bull case probability rises to → 45%
Stock likely moves to → $480-510
If Azure meets (37-38%) [45% probability]:
Bull case probability unchanged → 20%
Stock likely range → $440-470
If Azure misses (<37%) [20% probability]:
Bull case probability drops to → 5%
Stock likely drops to → $370-400
After Q4 Earnings (Jul 29), assuming Q3 beat:
If Copilot hits 70M+ AND margins stable [40% probability]:
Bull case probability rises to → 65%
Stock likely moves to → $540-580
If Copilot meets 60M but margins compress [35% probability]:
Bull case probability drops to → 30%
Stock likely range → $480-520
3+ years of trendline support at stake. $MSFT
Often called the "utility of the 21st century." Its moat is its enterprise ubiquity. With Azure integrated into the Office 365 stack and a $625 billion commercial backlog, it is the default "operating system" for global business productivity