
Forget Mega-Cap Tech: Look at these Midcap Quality Names with Earnings Momentum
I ranked them on earnings revisions, business quality, institutional buying and valuation and only three survived the full test.


I still see an equity market supported by earnings rather than one sliding into a recession or a liquidity crisis. That is an important distinction. Companies are still growing, estimates are still moving higher in several sectors, and investors are still willing to pay for businesses that execute.
What has changed is the shape of the opportunity. Leadership is no longer confined to a small group of mega-cap stocks. Small caps returned approximately 22.9% during the first half of 2026, compared with 9.6% for US large caps, while equal-weight indices and several sectors also participated.
At the same time, July delivered a sharp unwind in the previously dominant momentum trade. I do not read that as the start of a broad bear market. I read it as a rotation. Capital is moving between semiconductors, financials, defensives and smaller companies instead of leaving equities altogether.
That is why in this environment, my preferred strategy is earnings-revision momentum combined with quality.
Earnings revisions are one of the cleanest ways I know to separate a strong story from an improving business. A price chart can move because of positioning, short covering or multiple expansion. Estimates usually rise because analysts are seeing better revenue, margins, cash flow or guidance.
I therefore look for companies where the operating reality is improving faster than the market is pricing it. More specifically, I want to see:
positive EPS and revenue revisions over both one-and three-month periods;
guidance that is improving, rather than a company merely beating a lowered quarterly bar;
acceleration in revenue, operating income or free cash flow;
stable or rising margins;
a balance sheet that can support the growth story;
and a valuation that has not expanded faster than the underlying earnings.
My ideal setup is simple: earnings expectations are rising faster than the share price. That gives me fundamental momentum without forcing me to pay the full price of a crowded price-momentum trade.
So, I screened the S&P MidCap 400 and found 8 names that deserved a closer look. I then combined five different lenses: operating quality, earnings and revenue trends, market confirmation through analyst and institutional flows, a Reverse DCF to understand what growth the current price already assumes, and a sector-normalized valuation screen to compare each company with the relevant peer group.
The distinction matters because the best company is not automatically the best stock. A high-quality business can still be a poor opportunity when the valuation already assumes flawless execution. I treat the two valuation lenses as complements: the Reverse DCF tests the future growth embedded in the price, while sector normalization shows how much of a premium or discount I am paying relative to comparable companies.
The Businesses Behind the Tickers
Before looking at the ranking, I find it useful to step back and understand what each company actually does and how large it is. The table below gives me a quick sense of business model, market value and operating scale.
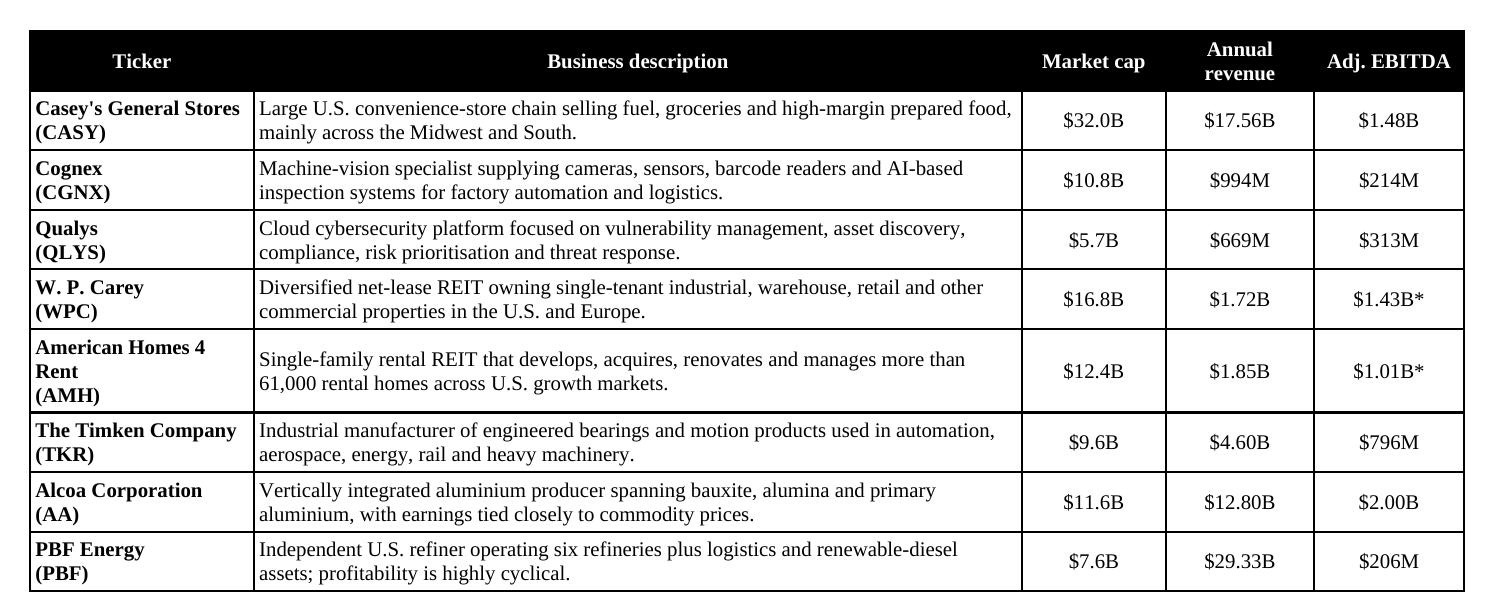
Scale note: Market capitalisation are approximate as of 17 July 2026. Revenue and EBITDA figures are rounded and use the latest complete fiscal year available (FY2026 for CASY; FY2025 for the other companies). *WPC uses adjusted EBITDA and AMH uses adjusted EBITDAre, the more relevant REIT equivalents. PBF EBITDA is adjusted and remains highly sensitive to refining margins.
The Quality Filters
I wanted to see which names combined revenue growth, improving profitability, acceptable leverage, cash generation and a valuation that could still be defended. This table is the operating screen, not the final ranking; that is why a company can score highly here and still move lower after valuation or market-flow analysis.
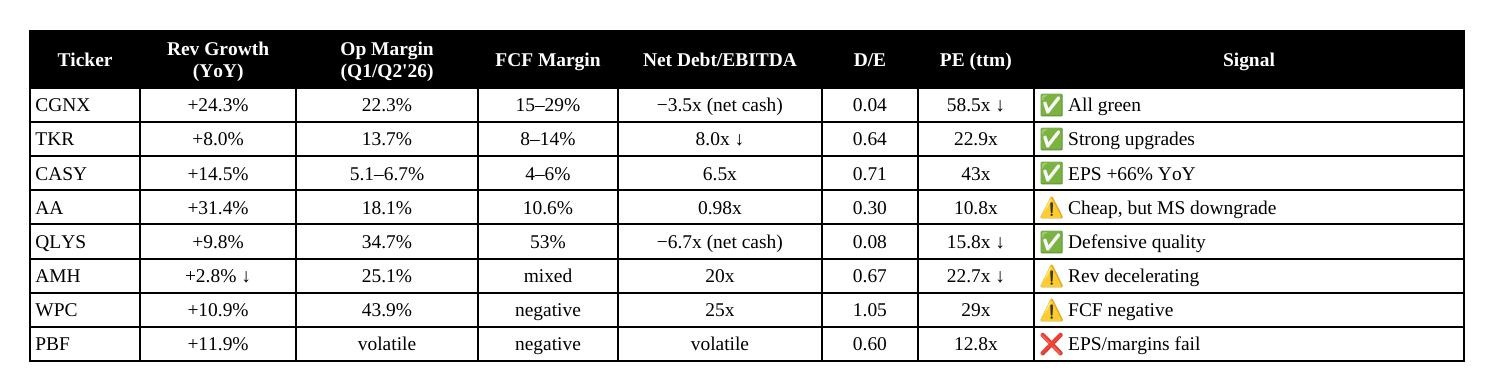
CGNX is the strongest operational recovery in the group. Revenue grew more than 24% year over year, the operating margin expanded from roughly 12% to 22%, gross margin moved toward 71%, and the company still has a net-cash balance sheet. The P/E remains high, but it is compressing as earnings catch up. The Q1 2026 EPS beat and the subsequent analyst upgrades support the recovery thesis.
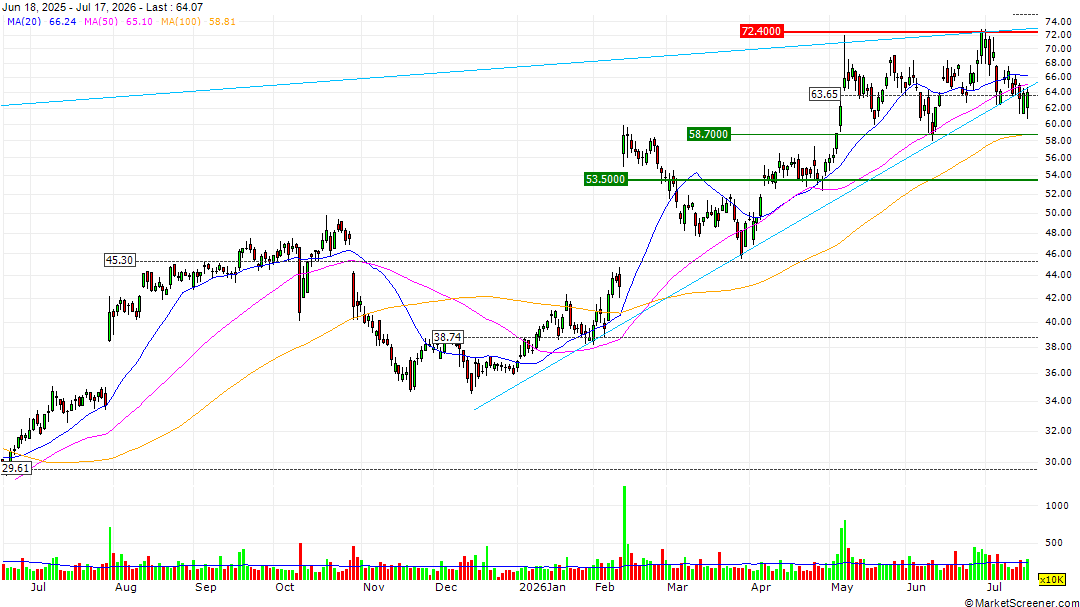
TKR is a quieter industrial compounder. Revenue and operating income are beginning to accelerate, and several analysts have moved their ratings and targets higher. The multiple is not excessive relative to the growth profile, but I cannot ignore the leverage. The opportunity works best if cash generation continues to reduce debt while demand remains resilient.
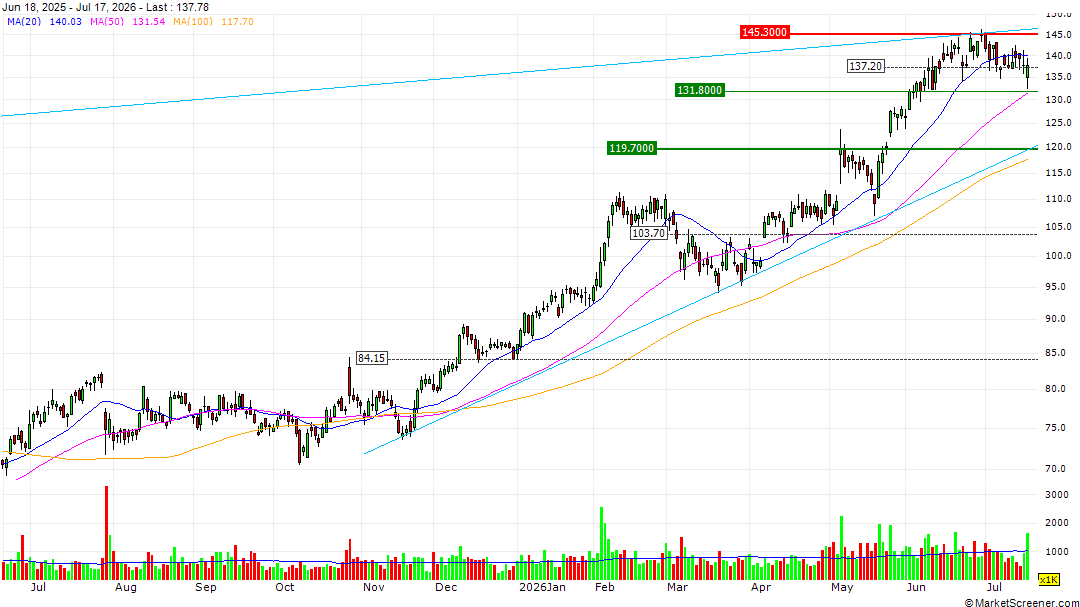
AA is the clearest value and cyclical-recovery case. Revenue and operating income have rebounded sharply, and Net Debt/EBITDA has fallen below 1x. The stock looks inexpensive on a headline P/E, but the Morgan Stanley downgrade and the sensitivity to aluminium prices remind me that this is still a commodity thesis. I would not treat it like a predictable compounder.
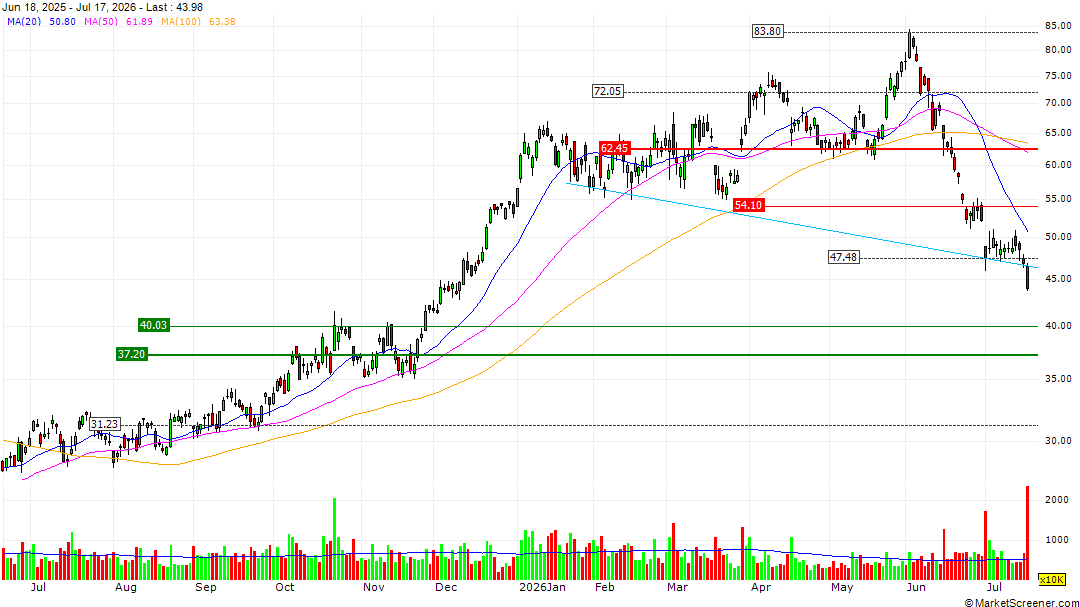
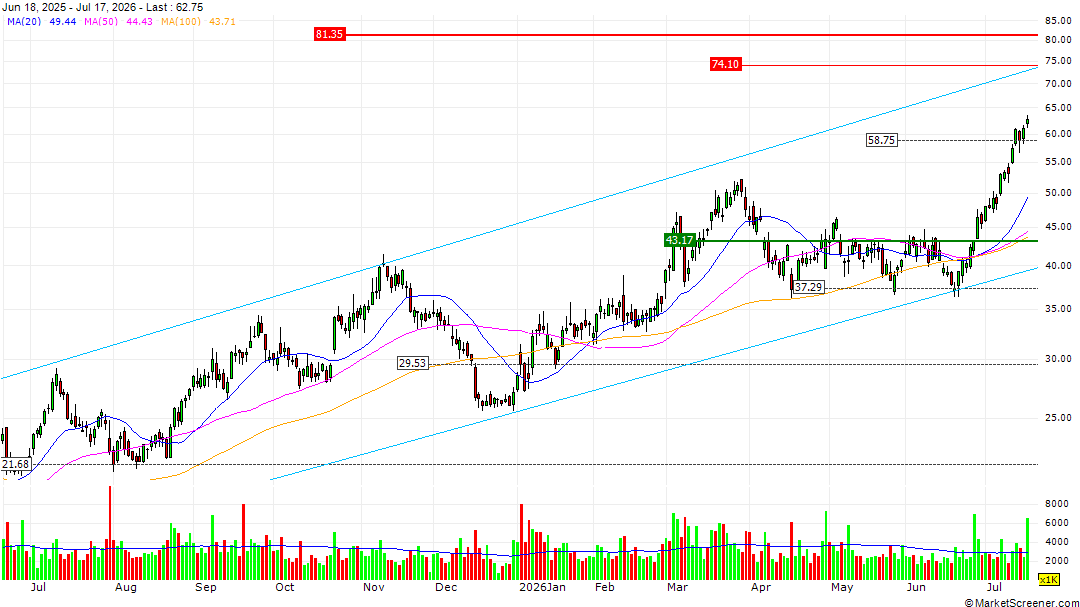
QLYS remains my preferred quality setup, although I now describe it as premium but defensible rather than plainly cheap. QLYS is the cleanest compounder, with exceptional margins, net cash and consistent execution. The main question is whether revenue growth near 10% is enough to protect the multiple over time.
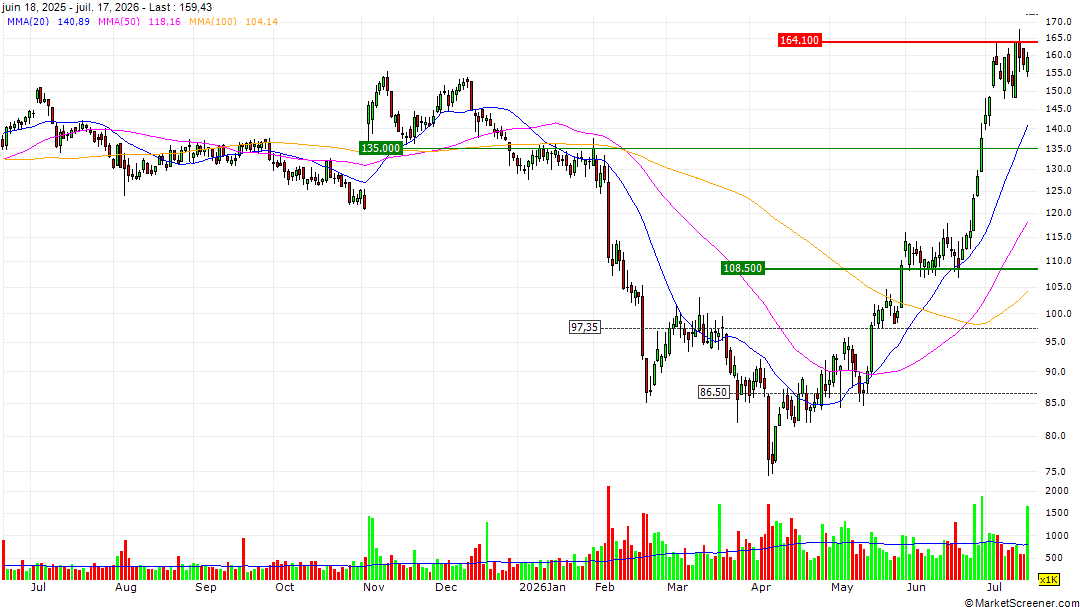
CASY is operationally excellent, but it carries acquisition debt and trades at the richest multiple in the group. I see a strong company, but not an obviously cheap stock.
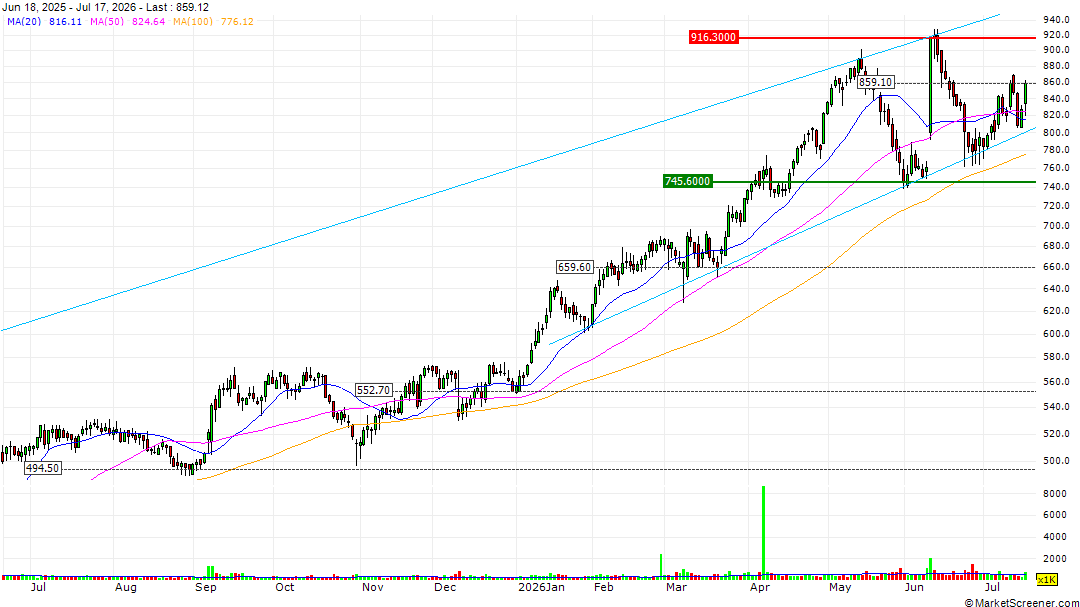
WPC and AMH sit in the middle. Their operations are improving, but leverage and capital intensity make raw FCF comparisons misleading. I would analyse both primarily through AFFO rather than GAAP free cash flow.
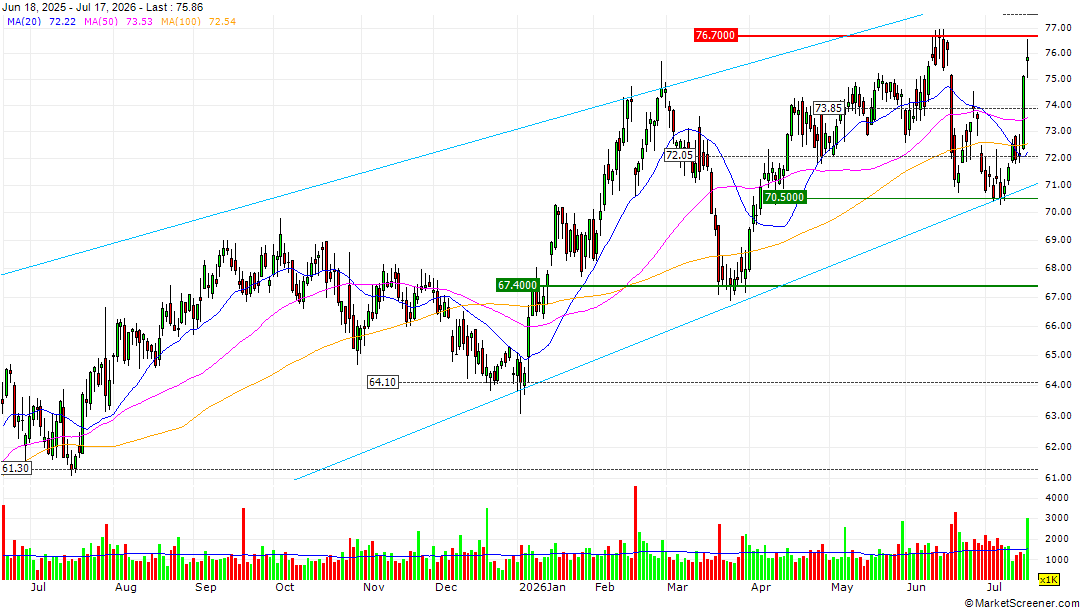
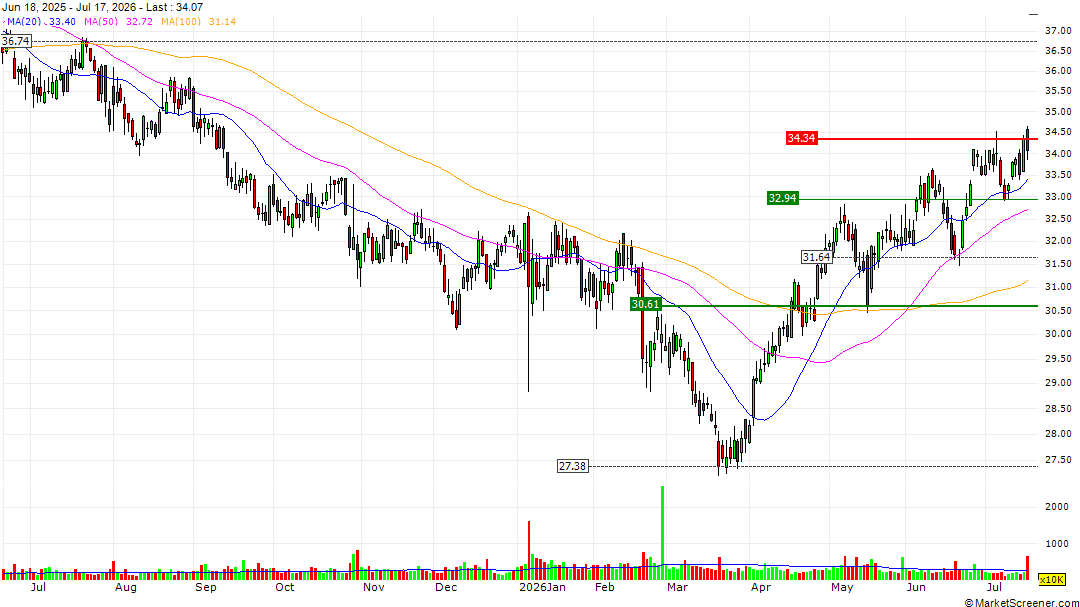
PBF scores last because the recent record includes negative FCF, repeated losses and rising net debt. I view it as a refining-margin trade, not a quality holding.
What the Reverse DCF says
The Reverse DCF is where I ask a different question. Instead of estimating a target price, I solve for the growth rate that the current enterprise value already requires. I then compare that implied rate with what the company has actually delivered.
