
From Semiconductor to Energy Supercycle: The Full AI Infrastructure Framework, Screening 35+ Companies Powering the Buildout
A Complete Portfolio Map of the AI Power Stack and the Specific "Moat" Names to Buy (and Avoid) Right Now.

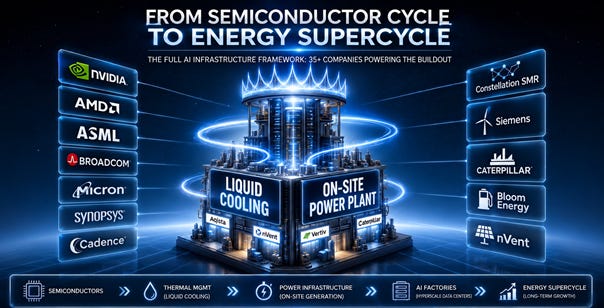
For two years, AI investing has been argued as two separate trades. The “silicon stack” trade is about chips, foundries, the tools that build them, and the clouds that rent them. The “energy stack” trade is about turbines, switchgear, cooling, and the contractors who put it all together. Brokers cover them with different analysts. Funds allocate to them under different mandates. ETFs slice them apart.
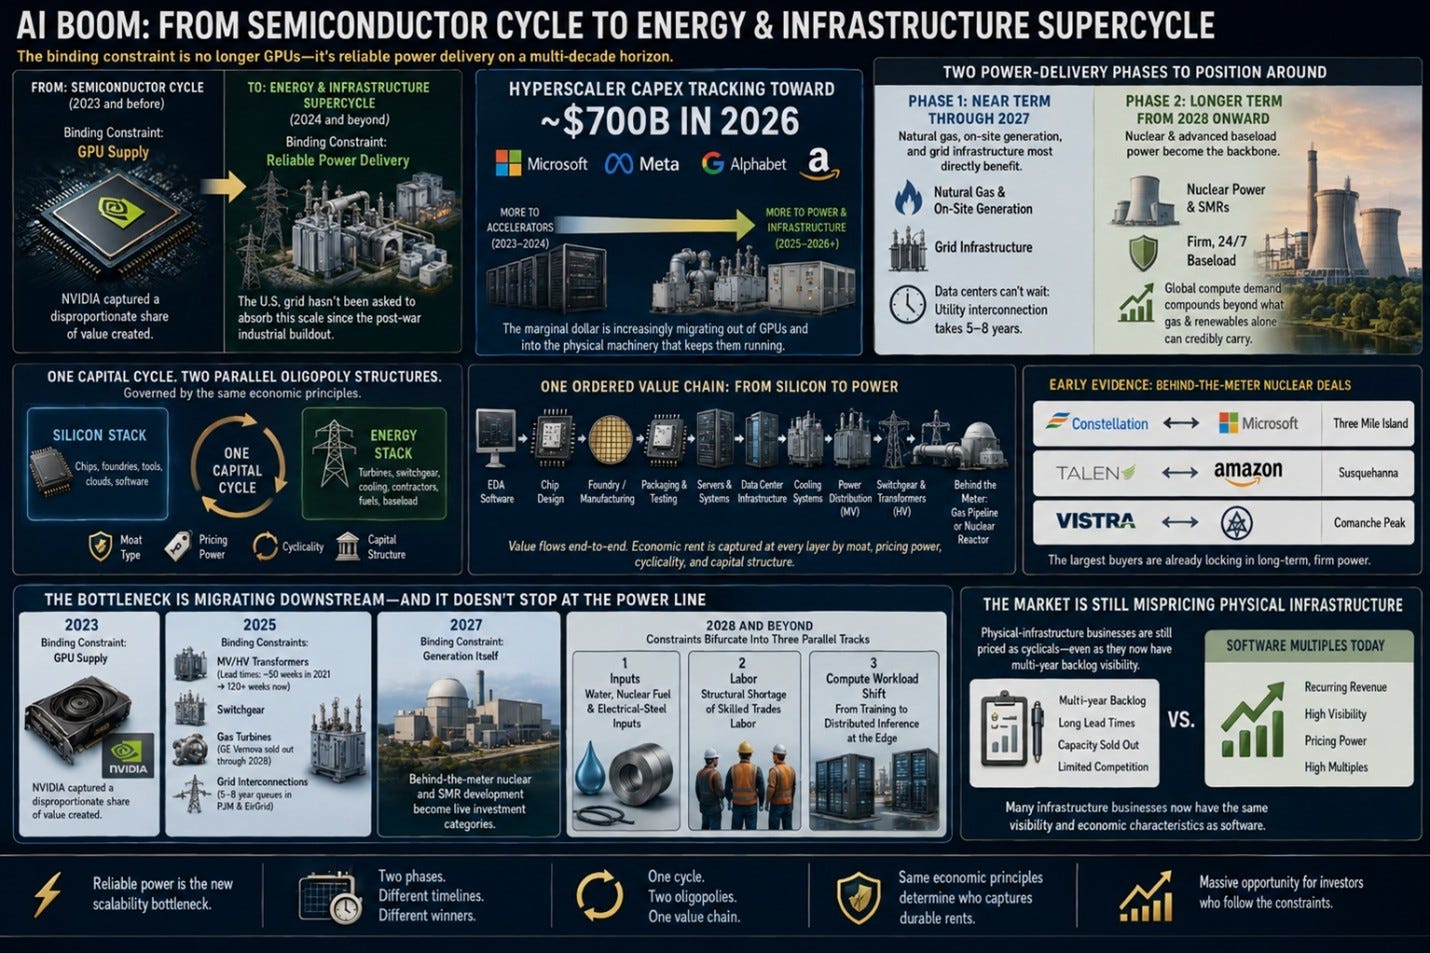
That separation is wrong, and it is being broken by a more fundamental shift: the AI boom is evolving from a semiconductor cycle into an energy and infrastructure supercycle. The binding constraint is no longer GPUs alone, it is reliable power delivery, on a multi-decade horizon, at a scale that the U.S. grid has not been asked to absorb since the post-war industrial buildout. Hyperscaler capex is tracking toward roughly $725B in 2026 across Microsoft, Meta, Alphabet and Amazon, and the marginal dollar is increasingly migrating out of accelerators and into the physical machinery that keeps those accelerators running.
That shift unfolds in two phases that investors can position around separately. Near term through 2027: natural gas, on-site generation, and grid infrastructure are the layers most directly benefiting from the constraint, because hyperscalers need immediate, scalable electricity for data centers that simply cannot wait the five to eight years a typical utility interconnection now takes. Longer term, from 2028 onward, nuclear and advanced baseload power become the backbone of AI infrastructure as global compute demand keeps compounding past the point where intermittent renewables and even fast-deploy gas can credibly carry it alone.
The most important practical observation is that the bottleneck is migrating downstream and it does not stop at the power line. In 2023, the binding constraint was GPU supply, and NVIDIA captured a disproportionate share of the value created. In 2025, the binding constraints are medium- and high-voltage transformers (lead times stretched from ~50 weeks in 2021 to 120+ weeks now), switchgear, gas turbines (GE Vernova sold out through 2028), and grid interconnections (5–8-year queues in PJM and EirGrid). By 2027, the constraint will increasingly be generation itself, which is why behind-the-meter nuclear and SMR development have become live investment categories rather than science projects. By 2028 and beyond, the constraint bifurcates into three parallel tracks that no single company list covers: water and nuclear fuel and electrical-steel inputs; the structural shortage of skilled trades labor; and the workload shift from training to distributed inference at the edge.
The article proceeds in four parts. Part I establishes the framework, the vocabulary, the value chain, and the bottleneck-migration pattern that organises everything that follows. Part II applies that pattern to the energy buildout itself, first through the four-layer power stack of the 2025–27 cycle, then through the three parallel tracks that define what comes after. Part III is the investor’s working layer, where mispricing persists, what to monitor in real time, and the valuation discipline that turns the framework into decisions. Part IV produces the ranked, concrete conclusion: which names to own, in which order, and at what size, validated by the underlying financial-quality data.
Part I: The Framework
Before mapping where the dollars go, the vocabulary and the value chain. Everything that follows in Parts II–IV rests on the three building blocks introduced here: how an AI data center is actually wired and powered, how capital flows through the stack from EDA software to the substation, and how the binding constraint has migrated year by year from chips to memory to grid equipment to turbines and where it goes next.
A 90-Second Primer on the AI Stack and Power Delivery
If terms like hyperscaler, HBM, behind-the-meter PPA, HALEU and MV switchgear are not part of your daily vocabulary, the rest of this article will be harder than it needs to be. This section is the quick mental model that makes everything that follows readable. Skip it if you already speak the language; come back to it if you get lost.
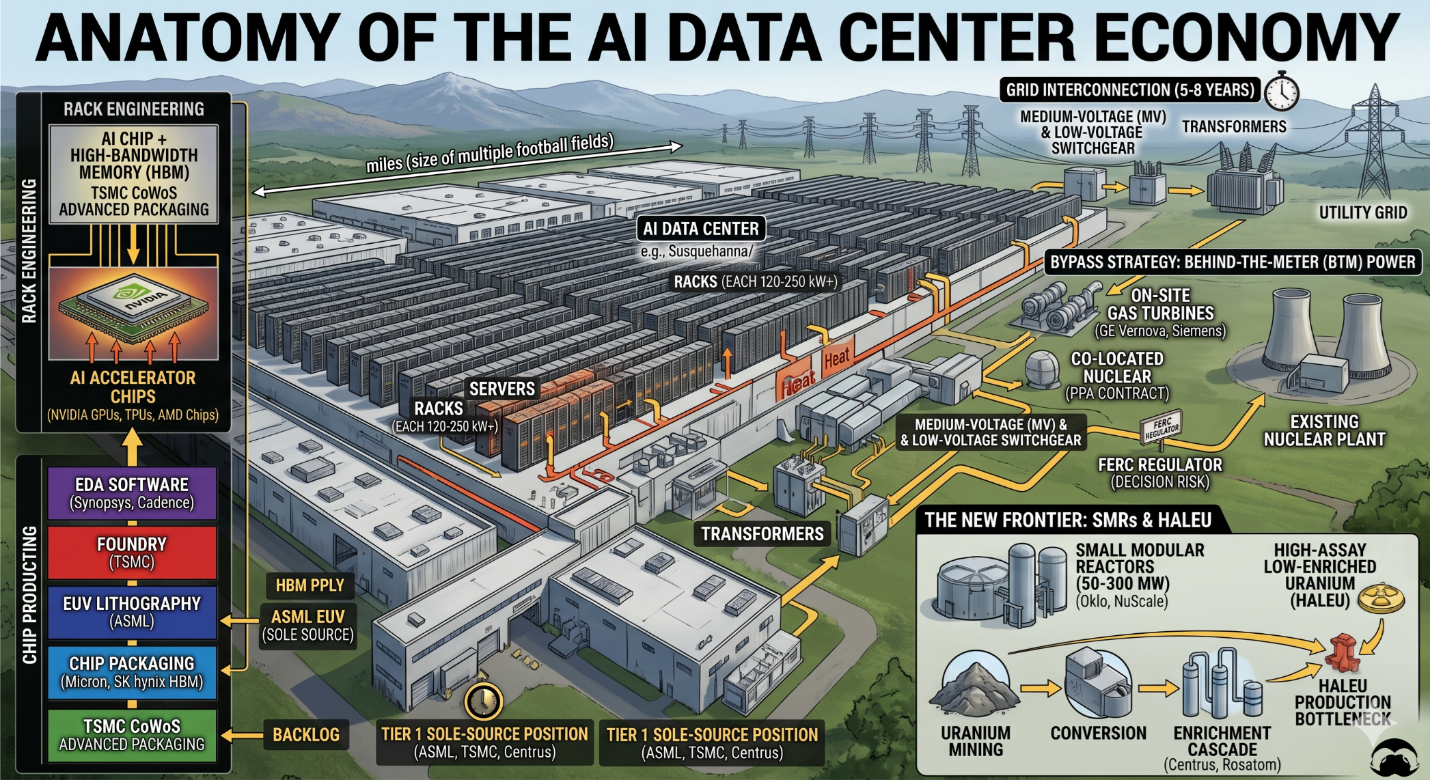
What an AI data center actually is. An AI data center is a warehouse-scale building (often the size of multiple football fields) packed with rows of metal cabinets called racks. Each rack is a tall vertical frame that holds servers, specialized computers built around AI accelerator chips, which today are mostly NVIDIA GPUs (graphics processing units repurposed for AI workloads) plus a smaller share of custom designs from companies like Broadcom (Google’s TPUs) and AMD. These accelerators consume electricity and produce heat in proportions that ordinary office computing does not approach. A modern AI rack with NVIDIA’s GB200 NVL72 system draws about 120 kilowatts (kW), roughly the same continuous power as 100 average U.S. homes. The next-generation Rubin platform is being designed for 250 kW+ per rack. A single hyperscale AI data center may contain thousands of these racks, which is why the conversation has moved from “megawatts” to “gigawatts” of power per site.
Three engineering challenges follow directly from this density. First, you need to bring that much electricity to the building, either from the utility grid (slow, queued, regulated) or from on-site generators (faster but burns fuel). Second, you need to distribute it inside the building from a high-voltage feed down through a chain of step-down equipment to the rack: this is the medium-voltage (MV) and low-voltage switchgear, transformers, and uninterruptible power supplies (UPS). Third, you need to remove the heat at 120–250 kW per rack, traditional air cooling no longer works, so the industry is shifting to liquid cooling, where coolant fluid flows directly across the chips through engineered manifolds. These three problems define most of the energy-side investment landscape.
The silicon side: how a chip becomes an AI accelerator. Building an AI chip is a multi-stage industrial process, and each stage is its own competitive market. First, electronic design automation (EDA) software, sold by Synopsys and Cadence as a duopoly is what chip designers use to create the blueprint; you cannot design a modern advanced chip without their tools. Second, the blueprint goes to a foundry (TSMC in Taiwan, primarily) that physically manufactures the chip on silicon wafers using extremely complex lithography machines. The most advanced of those machines, extreme ultraviolet (EUV) lithography is made only by ASML in the Netherlands, and there is no second source anywhere in the world. Third, the bare chips are combined with high-bandwidth memory (HBM), a specialized stacked memory made by Micron and SK hynix that sits right next to the GPU to feed it data fast enough, using an advanced packaging technique (TSMC’s CoWoS process is the dominant one) that physically connects the chip and the memory on a single integrated module. Fourth, those modules go into servers built by original design manufacturers (ODMs) like Celestica before reaching the data center. The chip companies that design but don’t manufacture (NVIDIA, AMD, Broadcom) are called fabless; the ones that both design and manufacture (Intel) are integrated device manufacturers (IDMs).
Two things matter to remember from this stack. One: NVIDIA’s CUDA software ecosystem is the reason its GPUs are so hard to displace: a vast amount of AI software has been written assuming CUDA’s instruction set, and porting it to other hardware is genuinely difficult. This is what people mean when they talk about NVIDIA’s “software moat.” Two: most of the meaningful chokepoints (EUV machines, HBM supply, CoWoS packaging) involve only one or two suppliers globally, which is why semi-related geopolitics is intense.
The energy side: why power is its own complex problem. When a hyperscaler wants to build a data center, the limiting factor is increasingly not money or land but electricity. The traditional path is to ask the local utility to extend a high-voltage line and step it down through transformers (which convert high voltage to lower voltage suitable for the building) and switchgear (the heavy electrical equipment that protects circuits and controls flow), then feed it into the data center’s internal distribution. This path now takes five to eight years in most U.S. grid regions, the wait time in the interconnection queue run by regional grid operators like PJM (the largest U.S. grid operator) and EirGrid (Ireland). For an AI build cycle measured in 18-month product generations, that is unacceptable.
The bypass strategy is behind-the-meter (BTM) power generation that is physically located on the data center site or directly connected to it, without going through the public grid. The two main flavours are on-site gas turbines (essentially jet engines that burn natural gas to spin a generator, which is what GE Vernova, Siemens Energy and Mitsubishi Heavy sell) and co-located nuclear (where a hyperscaler signs a power purchase agreement (PPA): a long-term contract to buy electricity at a fixed price with the operator of an existing nuclear plant, with the power flowing directly to a data center built next door). The Talen-Amazon Susquehanna deal and the Constellation-Microsoft Three Mile Island restart are the two highest-profile examples of co-located nuclear. The regulator that polices whether these arrangements are allowed under wholesale-electricity rules is FERC: the Federal Energy Regulatory Commission and in November 2024 FERC rejected a key amendment to the Talen-Amazon contract structure, which is why FERC risk appears throughout this article.
The new frontier: small modular reactors and their fuel. Beyond the existing nuclear fleet, the next generation of nuclear power is small modular reactors (SMRs), designs in the 50–300-megawatt range (versus 1,000+ MW for traditional reactors) that are intended to be factory-built and trucked to site. Oklo, NuScale Power, and BWX Technologies are the main listed names developing them. Most advanced SMR designs require a different fuel than traditional reactors: High-Assay Low-Enriched Uranium (HALEU), enriched to 5–20% U-235 (versus ~4% for conventional fuel). Producing HALEU at industrial scale requires specialized centrifuge enrichment capacity that today exists only in fragments. The Russian state nuclear company Rosatom holds the largest single share of global enrichment capacity; the only U.S. company currently producing HALEU is Centrus Energy, via a demonstration cascade in Piketon, Ohio. This is why uranium and the nuclear fuel cycle become a 2028+ bottleneck in the analysis later.
With that vocabulary in place, the next step is to see how capital actually flows through it. The same chip, server, rack, transformer and turbine described above appear as line items in a single hyperscaler capex stack and the way that stack is structured is what determines who captures economic rent and who simply consumes it.
The Full AI Capex Value Chain at a Glance
The simplest way to organize this is to read the chain top-to-bottom, in the order capital actually flows. Hyperscaler capex enters at the top, splits into IT-equipment and facility buckets, and exits at the bottom into the hands of contractors, utilities, and equipment vendors. Each layer has its own competitive structure and its own characteristic margin profile.
The Unified AI Capex Stack (2026 Update)
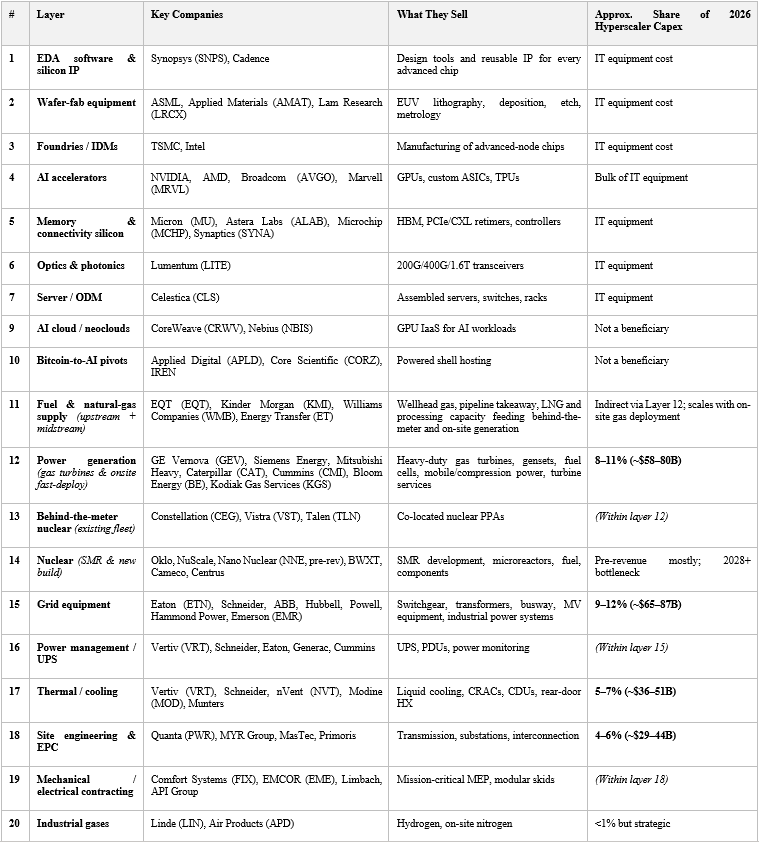
Here is the updated framework reflecting the massive upward revisions in 2026 hyperscaler capital expenditures. With the “Big Four” (Amazon, Microsoft, Google, Meta) projecting a combined capex of approximately $725 billion for 2026, the dollar values across the stack have effectively doubled since 2025.
The deduction from this single table is what most cross-domain coverage misses: layers 9 and 10 (neoclouds and Bitcoin-to-AI pivots) are not beneficiaries of hyperscaler capex; they are buyers of the same equipment, competing with hyperscalers for GPU allocation, power, and floor space. Their economics are the photo negative of the stack above them. They consume the capex; they do not capture it. This is a critical distinction that ETFs and thematic indices routinely blur.
A concrete illustration of how tightly the stack is actually linked: CoreWeave’s well-publicized 2025 guidance cut was largely traced back to delivery delays at Core Scientific, its primary hosting partner. CoreWeave (layer 9) depends on Core Scientific (layer 10) to deliver MW of powered shell on time; Core Scientific depends on transformer, switchgear and modular electrical-room vendors (layers 15–19) to deliver equipment on time; those vendors in turn depend on GOES steel from Cleveland-Cliffs (a future-track input). A single delay at any layer cascades upward through three or four layers of the stack. Investors looking at any one name in isolation routinely under-appreciate this serial dependency, and it is one of the strongest practical arguments for analyzing the full chain together rather than layer by layer.
Reading the stack vertically tells you where the dollars sit at any given moment. Reading it horizontally, across time, tells you where they are about to move. That is the bottleneck-migration pattern, and it is the single most useful predictive frame in this entire framework.
The Bottleneck Migration: 2023 → 2030+
The single most useful predictive frame across all three source documents is to track where the binding constraint sits over time. Capital flows to the constraint, and the constraint moves. This is not abstract; it is a directly observable pattern in lead times, backlogs, and order books, and once the pattern is visible, it can be extended forward.
Migration of the Binding Constraint
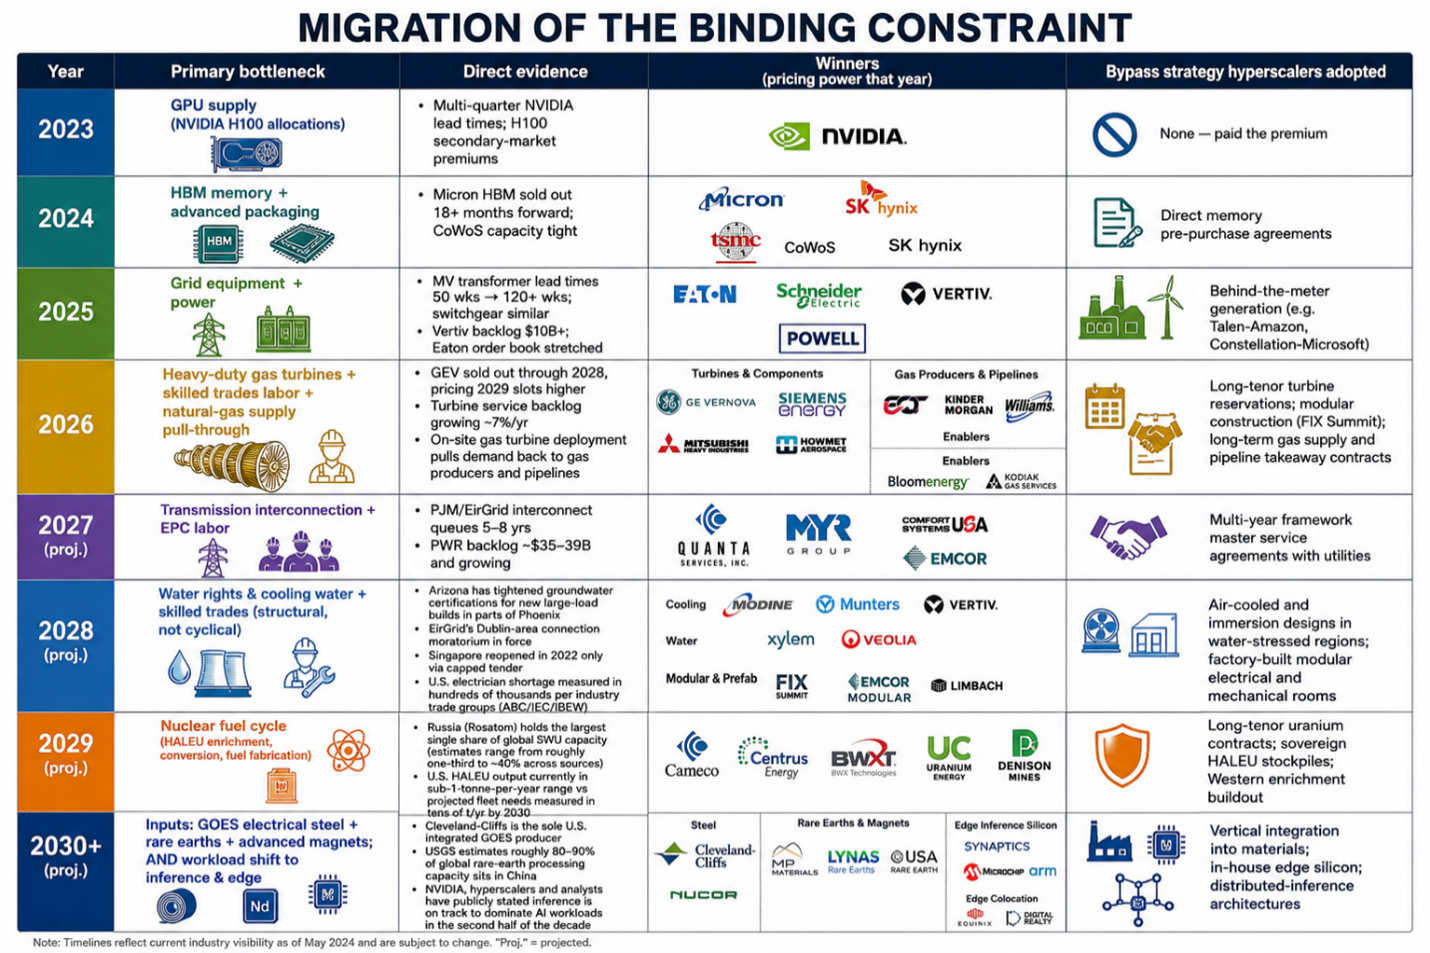
The deduction this enables: the asymmetric mispricing follows the bottleneck migration with a lag. The market was slow to price GPU bottleneck pricing power into NVIDIA in 2022, slow to price HBM scarcity into Micron in 2023, slow to price grid-equipment lead times into Eaton in 2024. Today, the equivalent under-pricing exists at the gas turbine and high-voltage transmission layer. GE Vernova’s grid-solutions backlog entered 2025 up >40% YoY; Quanta’s combined data-center and grid-modernization exposure for 2027 is what consensus models still treat as cyclical contractor revenue. And the equivalent layer for an investor with a 2027–30 horizon is no longer a single bottleneck; it is the three parallel tracks discussed in the next section.
Three building blocks are now in place. First, the vocabulary of AI infrastructure, racks and gigawatts, EDA and CoWoS, behind-the-meter PPAs and HALEU. Second, the twenty-one-layer capex stack that shows where every hyperscaler dollar actually lands, and why neoclouds and Bitcoin-pivot data centers are buyers rather than beneficiaries of that flow. Third, and most importantly, the bottleneck-migration pattern that has run cleanly from GPUs (2023) to memory (2024) to grid equipment (2025) to turbines and transmission (2026–27), and that points beyond, to fuel-cycle, water, modular labor, and inference.
Part II takes that pattern and applies it to the energy buildout itself. First the four-layer power stack that defines the current cycle through 2027, then the three parallel tracks that define what comes after.
Part II: The Energy Supercycle and What Comes After
The energy part of the AI buildout is not a single trade. It is two distinct phases stacked on top of each other: a four-layer power-delivery problem solved between now and 2027, and a three-track bottleneck migration that defines 2028 onward. Different physical constraints, different competitive structures, different beneficiaries.
The AI Power Stack: Four Layers of Energy Delivery
The most useful way to think about the energy part of the buildout is not as a single category called “utilities and infrastructure” but as four ordered layers of power delivery, each with a different time-to-deploy, a different competitive structure, and a different set of beneficiaries. Read top-to-bottom, the four layers describe the physical journey from a molecule of methane in the ground to an electron arriving at a GPU socket, and read in time order they describe how the AI power problem actually gets solved over the next decade, from the fuel hyperscalers need next year, through the on-site generation they are deploying right now, through the grid build-out that has to catch up by 2027, to the new baseload they will need from 2028 onward.
The AI Power Stack: Four Layers, In Order of Time-to-Deploy
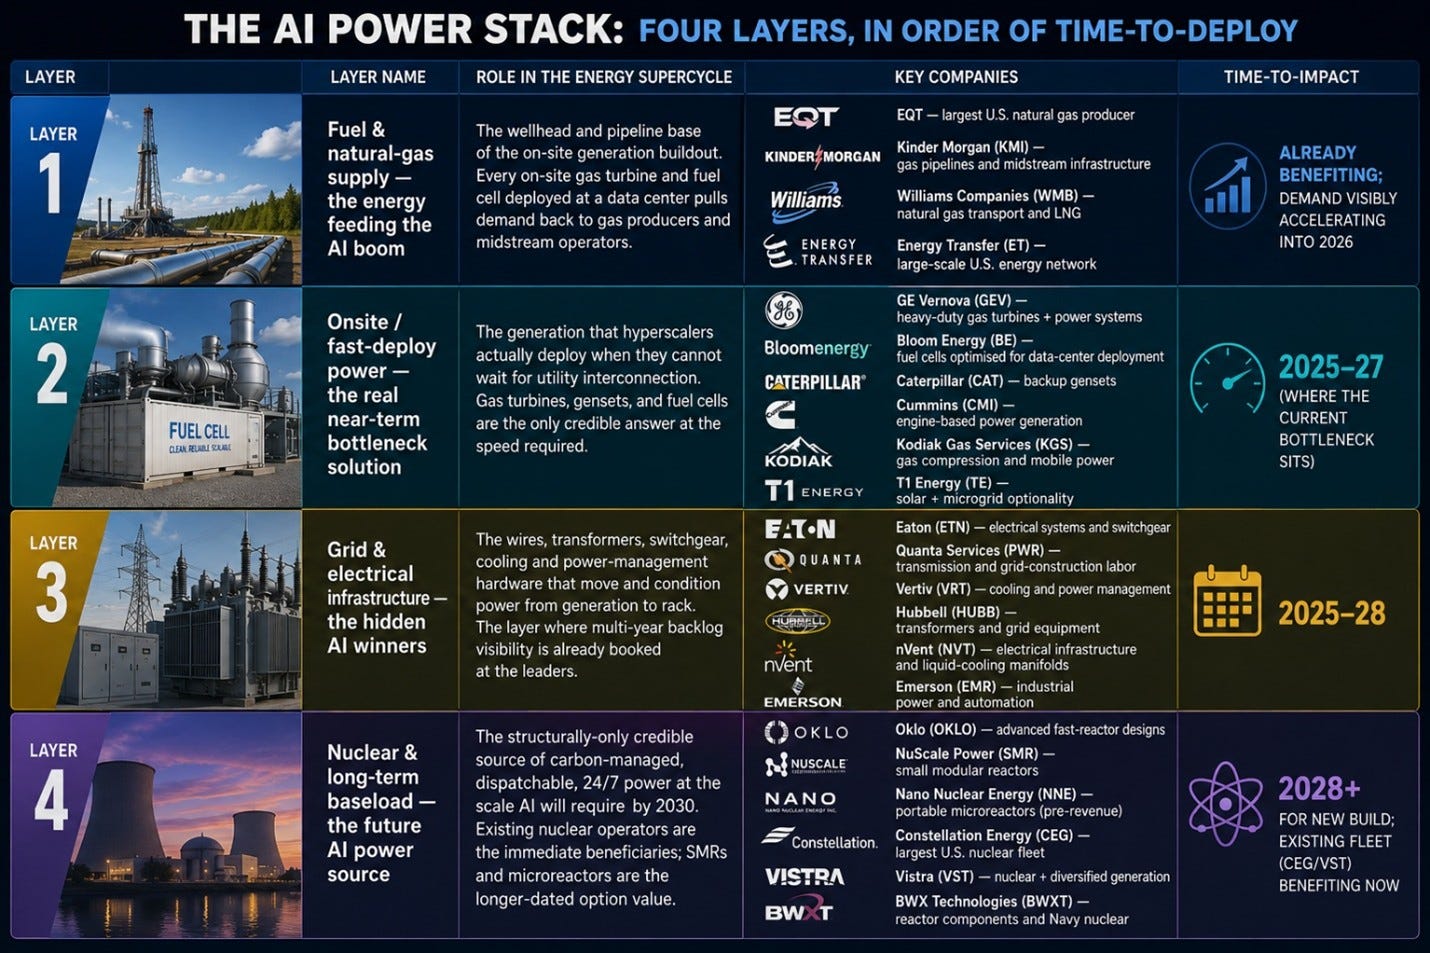
A few cross-layer observations matter more than any single name in the table.
First, GE Vernova spans Layers 2 and 3 in a way no other company does. GEV’s heavy-duty gas turbines sit in Layer 2 (fast-deploy generation), but its Grid Solutions business: high-voltage equipment, HVDC, transformers, sits squarely in Layer 3. This is the structural reason the GEV backlog has compounded faster than any single-layer competitor: it captures both the near-term gas-turbine wave and the multi-year grid build-out simultaneously, on essentially the same hyperscaler customer base. The consolidated backlog reported in the ~$150B range is the financial fingerprint of that two-layer franchise.
Second, Constellation, Vistra and Talen are dual-class beneficiaries. They sit in Layer 4 (long-term baseload) as owners of existing nuclear capacity, but they are realising those long-term economics today through behind-the-meter PPAs at premium prices (the Talen–Amazon Susquehanna deal, the Constellation–Microsoft Three Mile Island restart, Vistra’s optionality at Comanche Peak). The premium is the difference between selling electrons into wholesale markets at standard locational marginal pricing and selling them directly to a hyperscaler at $80–100/MWh on a 25-year contract. (To translate the units for non-specialists: $80–100 per megawatt-hour, over a 25-year contract, applied to the generating capacity in kilowatts, implies a per-kW valuation of the underlying asset of roughly $4,000, versus the ~$2,000–2,500 per kW the market currently capitalises wholesale-only nuclear plants at. In other words, a behind-the-meter PPA roughly doubles the implied value of the same nuclear asset compared to selling its output into the open grid.) The thesis-break risk is entirely on FERC: see the November 2024 rejection of the Talen-Amazon Interconnection Service Agreement amendment.
Third, the natural-gas supply layer (Layer 1) is the least crowded trade across the whole power stack. EQT, Kinder Morgan, Williams Companies and Energy Transfer all sit one layer upstream of the gas turbines that are already sold out through 2028. They are not normally covered by AI-thematic analyst, they show up under “energy” coverage instead and consequently the demand pull-through from data centers is structurally under-reflected in consensus models. EQT in particular, as the largest U.S. natural gas producer, sits in a position analogous to the gas-turbine OEMs one layer downstream: a sole-tier supplier into a structurally-tight market with multi-year contract visibility now appearing. The Kinder Morgan / Williams / Energy Transfer pipelines are the equivalent of Quanta in the wires layer: toll-collectors on a flow of molecules that has to grow if Layer 2 is to grow at all.
Fourth, Bloom Energy (BE) and Kodiak Gas Services (KGS) are second-derivative plays on Layer 2. Bloom’s fuel-cell platform has already been deployed by hyperscalers (notably Amazon Web Services at multiple sites and Equinix in colocation contexts) as a way to bring on-site, low-emissions power online faster than gas turbines and without waiting for utility build-out. KGS provides the compression and mobile power that makes distributed gas-fired generation actually deployable. Both are smaller, more volatile, and less consensus-covered than GEV or CAT, and both have meaningful upside if on-site deployment continues to outpace utility interconnection schedules.
Fifth, the placement of the four layers in time matters more than the placement in space. Layer 1 (gas supply) is already pricing in; Layer 2 (onsite generation) is the live 2025–27 bottleneck; Layer 3 (grid equipment) is in mid-cycle and partially priced at the leaders (VRT, ETN) but still under-priced at the EPC tier (PWR, MYRG, FIX); Layer 4 (nuclear) splits cleanly into “existing fleet, benefiting now” (CEG, VST, TLN) and “new build, optionality only” (Oklo, NuScale, NNE, plus the Centrus/BWXT fuel cycle). The right portfolio response is to hold across layers in proportion to where each one sits on the time curve, not equally weighted, and not concentrated in a single layer.
The four-layer power stack defines the visible cycle through 2027. But the binding constraint does not stop at the substation. From 2028 onward it bifurcates, not into another layer of the same diagram, but into three structurally different tracks running in parallel. That is the subject of the next section.
Beyond Energy: The Three Forward Tracks of Bottleneck Migration
Through 2027, the bottleneck migration is linear and easy to read off the order book: chip → memory → grid → power → transmission. From 2028 onward, the simplicity breaks. The constraint does not stop migrating, it bifurcates into three structurally different tracks running in parallel, each with its own beneficiaries and its own set of mispriced names. Investors thinking past the current energy trade should be mapping all three.
The three tracks are inputs and materials (what the buildout consumes), labor and deployment (who actually installs it), and workload shift (what the GPUs are increasingly being used for). They do not compete with each other for capex, they all attract spending simultaneously and the companies that win each one are largely distinct from the companies winning the 2025–27 cycle.
Track 1: Inputs and Materials: Water, Fuel, Steel, Magnets
The 2025–27 bottleneck was equipment scarcity (transformers, switchgear, turbines). The 2028–30 bottleneck is one layer further upstream: the raw inputs and consumables those pieces of equipment depend on. Four distinct sub-bottlenecks are visible.
Water and cooling water rights. Liquid-cooled racks at 250 kW+ consume materially more water than the air-cooled facilities of the previous decade. Water has become a binding siting constraint in several major data-center geographies: utilities in the Phoenix metro area have raised constraints on new large-load water hookups in suburban areas; Northern Virginia’s “Data Center Alley” is approaching infrastructure limits; and Ireland’s grid operator EirGrid has effectively held new Dublin-area data-center connections to a multi-year queue. Water is not directly bought from hyperscalers in the way silicon is, but it is the constraint that decides where the buildout can physically occur. Beneficiaries: Xylem (XYL) and Veolia/Evoqua in water treatment and reuse; Modine (MOD) and Munters (MTRS.ST) on air-side and adiabatic cooling for water-stressed regions; Vertiv (VRT) on immersion cooling, which uses dielectric fluid in a closed loop rather than water. The Vertiv immersion-cooling line is, in particular, a clean second-derivative play on this constraint, the company is already a Tier 2 winner of the current cycle and an early winner of the next.
Nuclear fuel cycle. If 2027 is when behind-the-meter nuclear scales and SMRs begin commercial deployment, 2029 is when fuel becomes the binding constraint. Uranium mining, conversion, and enrichment are bottlenecked at every stage, and the highest-leverage chokepoint is High-Assay Low-Enriched Uranium (HALEU), the 5–20% U-235 fuel that most advanced SMR designs require. Russia, through Rosatom, holds the largest single share of global enrichment capacity (estimates range from roughly one-third to ~40% of SWU capacity depending on source), an obvious single point of failure in a geopolitically tense environment. U.S. HALEU production capacity is currently in the sub-1-tonne-per-year range against projected fleet needs measured in tens of metric tons per year by 2030. Beneficiaries: Cameco (CCJ) on mining; Centrus Energy (LEU) on HALEU enrichment, which is functionally the sole-source U.S. position; BWX Technologies (BWXT) on fuel fabrication and the Naval Nuclear Propulsion Program, which provides a non-AI demand floor that few investors fully appreciate. Cameco is already in the bottleneck table for 2028; the more interesting under-followed names are Centrus and BWXT.
Electrical steel. Grain-oriented electrical steel (GOES) is the magnetic core material in every transformer the buildout requires. The U.S. has effectively one domestic integrated producer (Cleveland-Cliffs, via the legacy AK Steel Butler operations), and global capacity is concentrated in a small number of Japanese (Nippon Steel/JFE) and Korean (POSCO) producers. Transformer demand is already running ahead of GOES supply, and the lead-time math gets worse if domestic-content provisions intensify. Beneficiaries: Cleveland-Cliffs (CLF) as the only U.S. integrated GOES producer; Nucor (NUE) to the extent it expands into transformer-grade electrical steel; the Japanese and Korean incumbents if Western supply chains diversify rather than reshore.
Rare earths and advanced magnets. Neodymium-iron-boron (NdFeB) magnets are essential to the motors and generators inside the broader AI infrastructure value chain: pumps and fans in liquid-cooling systems, the generators in behind-the-meter gas-turbine and wind-turbine installations, and the actuators in modular electrical equipment. The U.S. Geological Survey has consistently estimated that roughly 80–90% of global rare-earth processing capacity sits in China, with the U.S. and allied capacity still in the buildout phase. Beneficiaries: MP Materials (MP), the only fully integrated U.S. producer (Mountain Pass mining plus Fort Worth magnet fabrication); Lynas Rare Earths (LYC.AX) as the leading non-Chinese mine-to-oxide producer; and pre-IPO names such as USA Rare Earth. These are speculative relative to the silicon-stack names but are direct beneficiaries of any further commodity-side decoupling.
Track 2: Labor and Deployment: The Scarcity That Doesn’t Show in a Backlog
The 2026–27 bottleneck table flags skilled trades labor as a recurring risk for contractors. This is not a cyclical labor-cost issue; it is a structural shortage of trained electricians, pipefitters, and mechanical technicians that no amount of hyperscaler capex can solve quickly. Industry trade groups (ABC, IEC, IBEW) have estimated the U.S. shortage of qualified electricians in the several-hundred-thousand range before the AI-driven incremental load, and IBEW apprenticeship pipelines run 4–5 years; expanding the throughput of trained labor is a decade-long project, not a budget question.
From 2028 onward, this means three things converge. First, margin pressure on traditional site-labor contractors intensifies: Quanta, MYR Group, Comfort Systems and EMCOR will all face ongoing wage inflation that may compress gross margins below the sub-13% threshold flagged earlier in this article for PWR. Second, the companies that have actually built a factory-labor model start to dominate share. Comfort Systems’ Summit Industrial Construction subsidiary, which prefabricates entire electrical rooms and mechanical skids off-site, is the prototype. Third, a category of “modular MEP specialist” emerges as a distinct investment theme, adjacent to but distinct from the EPC contractor category that defined 2025–27.
Beneficiaries on the modular and factory-built side: Comfort Systems (FIX) via Summit; EMCOR (EME) through its modular construction acquisitions; Limbach Holdings (LMB) as a smaller-cap pure play on facility services and increasingly prefab; API Group (APG) for its scaled trades labor pool. The opposite side of this trade, the contractors most exposed to the wage-inflation squeeze is a meaningful risk for the names doing the most pure on-site work and the least factory-built work. MasTec (MTZ) and Primoris (PRIM) face this; even Quanta does, despite its multi-year MSA cushion.
A related under-followed name: WillScot Mobile Mini (WSC) in modular structures and on-site facilities. As the build-out shifts toward modular construction and temporary on-site infrastructure (work camps for grid build-outs in rural areas), the demand for industrial modular space rises with it. This is a third-derivative play and worth flagging only because it would not normally surface in an AI infrastructure article.
Track 3: Workload Shift: From Training Centralization to Inference at the Edge
The deepest of the three forward tracks is the one that does not yet show up in capex tables at all. To make the distinction concrete for non-specialists: training is the multi-week process of teaching a model by exposing it to enormous datasets, this is what happens in the massive AI data centers that have dominated the news for two years; inference is the process of actually using the trained model to answer a query, generate an image, or drive a car, this happens billions of times a day, every time someone uses an AI product, and each individual inference takes milliseconds. The two workloads have completely different hardware, energy, and geographic requirements. The 2023–27 buildout has been overwhelmingly about training: huge centralized clusters running massive models for weeks or months. The 2028+ buildout is increasingly about inference: running those models in production, on user requests, at latencies measured in milliseconds rather than days. Inference compute is fundamentally different from training compute in three ways that change the winners.
First, inference is geographically distributed by necessity. A user in Paris does not want her query routed to Iowa and back; a self-driving car cannot wait 200 ms for a round trip to a hyperscale data center. Inference workloads naturally migrate toward the edge of the network, to regional data centers, telco facilities, and ultimately to devices themselves. The implication: the centralized AI factory is not the only deployment topology, and from 2028 onward an increasing share of inference dollars goes to distributed and edge infrastructure rather than to gigawatt-scale campuses.
Second, inference unit economics favor different silicon. Training is bandwidth-bound and benefits from the largest GPUs with the most HBM. Inference is latency-bound and increasingly served by smaller, cheaper, specialized chips: Google’s TPU-inference variants, AMD’s MI series, Broadcom’s networking-side accelerators, and a growing universe of custom ASICs and edge processors. Crucially, CUDA’s moat is thinner in inference than in training, the inference workload is more easily portable across hardware than training is, which is precisely why hyperscalers are funding alternatives.
Third, inference volume scales with user activity, not with model training schedules. Training capex is lumpy and tied to model release cycles. Inference capex grows continuously with adoption, and NVIDIA, hyperscaler CFOs, and independent analysts have all publicly stated that inference compute is on track to dominate AI workloads by the second half of the decade as deployed models accumulate. The implication for the next bottleneck: at some point in 2028–30, the constraint shifts from “can we build enough training capacity” to “can we deploy enough inference capacity close enough to the user”, and the company list that benefits is meaningfully different.
Beneficiaries on the edge-and-inference side: Synaptics (SYNA) with its Astra Edge AI platform, an under-followed name explicitly repositioning around this thesis after the Broadcom IoT-asset acquisition in early 2025; Microchip (MCHP), which is currently in cyclical trough but whose 7–15 year industrial design wins create a multi-year inference-adjacent franchise as those embedded systems pull in more AI capability; Arm Holdings (ARM), whose architecture dominates edge and mobile inference; AMD (AMD), whose MI308 ramp and embedded business position it for inference workloads in a way pure training-focused vendors are not; and on the distributed-infrastructure side, Equinix (EQIX) and Digital Realty (DLR), whose interconnection-dense colocation footprints are the natural home for inference-tier compute. Equinix and Digital Realty are REIT-structured and trade more on cap rates than on growth, but their relevance to the AI buildout grows materially as the inference share grows.
On the optical and networking side, the inference shift extends the runway for the same companies that benefited from training: Lumentum (LITE) for transceivers between edge sites; Coherent (COHR) on the same theme; Ciena (CIEN) and Cisco (CSCO) for data-center interconnect; and silicon photonics players (Marvell’s Celestial AI acquisition becomes more valuable in an inference-heavy world, since latency-bound workloads benefit disproportionately from in-package optical).
The most contrarian inference-shift implication is for NVIDIA itself. NVIDIA’s training-side dominance is well understood and largely priced in. Its inference-side position is less obviously dominant: the unit economics favor smaller, cheaper chips, and the customers (which now include every cloud provider, every telco, and every enterprise deploying models) have far more incentive to qualify alternatives than the original training-side customer base did. Whether NVIDIA defends inference share with its Grace + Blackwell + Rubin roadmap or cedes meaningful ground to Broadcom, AMD, and custom ASICs is the single most important question for the silicon stack from 2028 onward.
How the Three Tracks Compare
The three tracks differ in time horizon, market size, and how directly they extend the current names versus introduce new ones. A simple comparison:
The Three Forward Tracks Side by Side
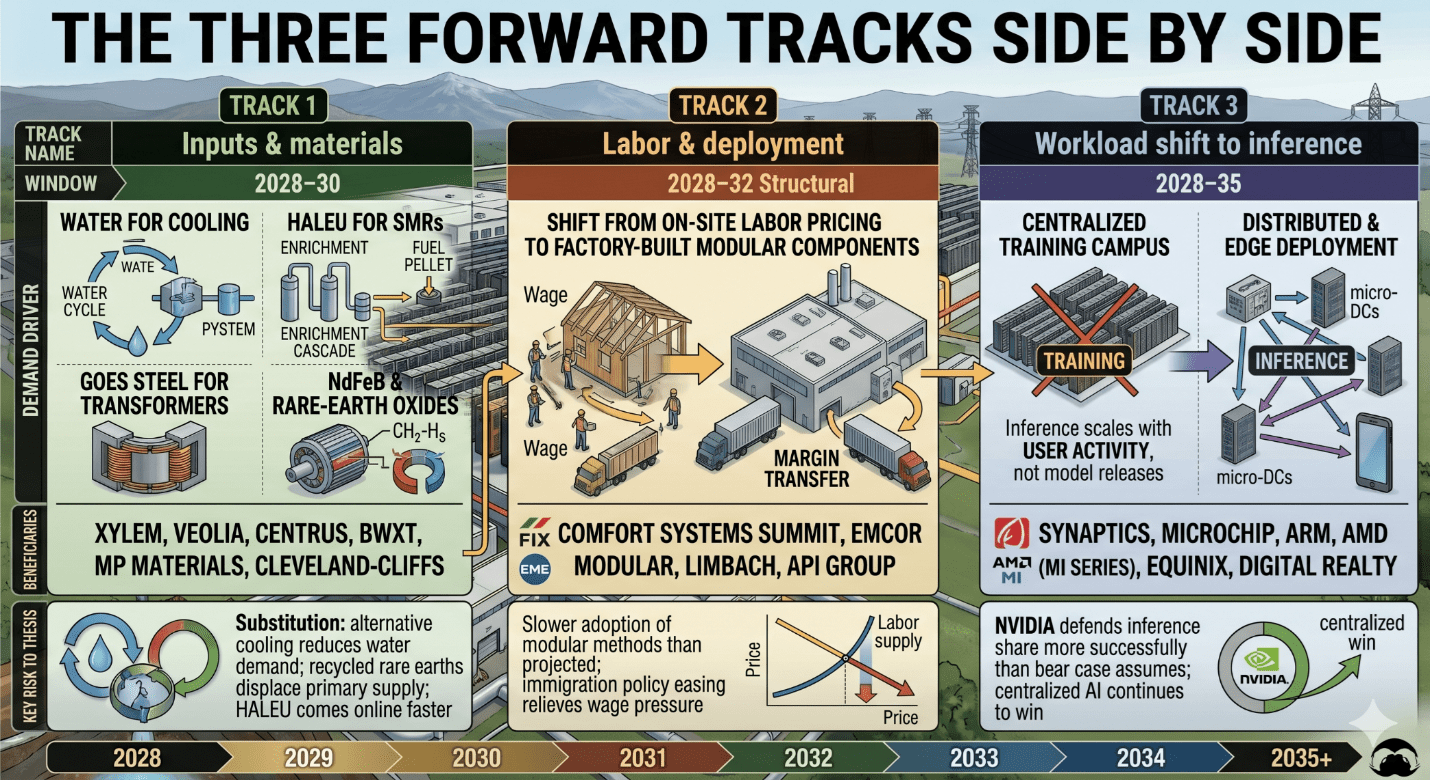
The key cross-track observation: only the workload-shift track meaningfully overlaps with the silicon-stack universe of the 2025–27 cycle. Inputs/materials and labor/deployment are genuinely new investment categories. This matters for portfolio construction: an investor who builds a strong position around the 2025–27 bottleneck (GEV, PWR, VRT, ETN, Howmet) and then simply rolls that into 2028+ exposure does not capture the inputs or labor tracks at all. Capturing the full bottleneck migration requires either rotating into new names or holding a deliberately broader basket from the start.
The energy half of the AI buildout is now fully mapped. The 2025–27 cycle plays out across four physical layers: gas supply, on-site generation, grid equipment, and existing-fleet nuclear, with GE Vernova straddling Layers 2 and 3, Constellation/Vistra/Talen straddling Layer 4 and the near-term BTM trade, and the gas-supply layer (EQT, Kinder Morgan, Williams, Energy Transfer) sitting in the least-crowded position of all because the analyst community has not yet rotated coverage.
From 2028 onward the migration runs in three parallel tracks: inputs (water, HALEU, GOES steel, rare earths), labor (the structural shortage and the rise of modular MEP), and workload (training giving way to distributed inference). These are not extensions of the current winners; they are largely new investment categories, and the portfolio that captures them requires either deliberate rotation or a broader basket from the start.
Parts I and II have built the map. Part III turns it into a working investor’s toolkit: where the mispricing actually lives today, how to identify the next one before consensus catches up, and the valuation discipline that distinguishes a thesis bet from a quality compounder.
Part III: Where the Mispricing Lives
A framework that maps the buildout is only useful if it produces decisions. This part turns the analysis into three working tools: a cross-stack screen of asymmetric setups visible today, a set of five real-time signals that flag the next bottleneck 12–24 months before consensus does, and three valuation anchors that distinguish durable rent capture from rented growth.
In the part IV, the framework produces a ranked answer, not a basket. Its part puts the names in order, separates compounders-with-a-tailwind from thesis bets sized for revenue revisions, and then validates the ranking against eight quarters of underlying ROIC, margin, FCF and balance-sheet data, the discipline that catches the cases where the thesis is right and the quality data confirms it, the cases where the thesis is right but the quality data argues for restraint, and the cases where the quality data forces a re-rank.