
Market Pulse & Macro Notes (4th May 2026)

Disclaimer: For informational purposes only; no investment advice.
Market Commentary & Price Action
Welcome to today’s market pulse. We are coming off a record-breaking April where big tech and semiconductors really flexed their muscles to push the markets into new territory. While the S&P 500 and the Nasdaq Composite are hitting fresh all-time highs, we have to keep an eye on the fact that most individual stocks aren’t actually joining the party.
Data as of market close, May 1, 2026
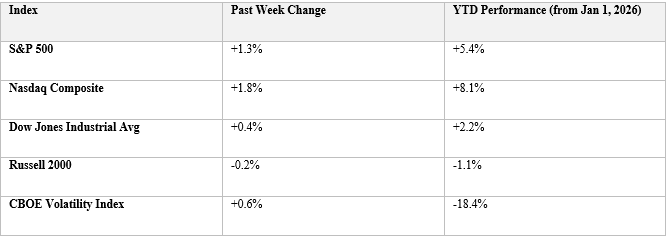
Looking at the S&P 500, the index just notched its fifth straight winning week and hit a new peak of 7,230. It sounds great on the surface, but this is a very narrow rally. Most stocks are still trading below their 200-day moving average, which shows just how much we are leaning on a few mega-cap giants to keep the overall index afloat during these uncertain times. Over on the Nasdaq, the story is all about the AI industrial complex. Huge inflows into semiconductors and AI infrastructure after a great earnings season have pushed the index to an 8.1% return since the start of the year. It is worth noting that these tech gains are becoming increasingly sensitive to the energy market because these massive AI systems require so much power to run.
In terms of what is actually moving, semiconductors and gasoline-linked funds were the clear winners this past week. On the flip side, precious metals have actually softened. It is a bit surprising given the global tension, but it seems investors are betting heavily on U.S. domestic growth and foreign investment rather than hiding out in traditional safe havens.
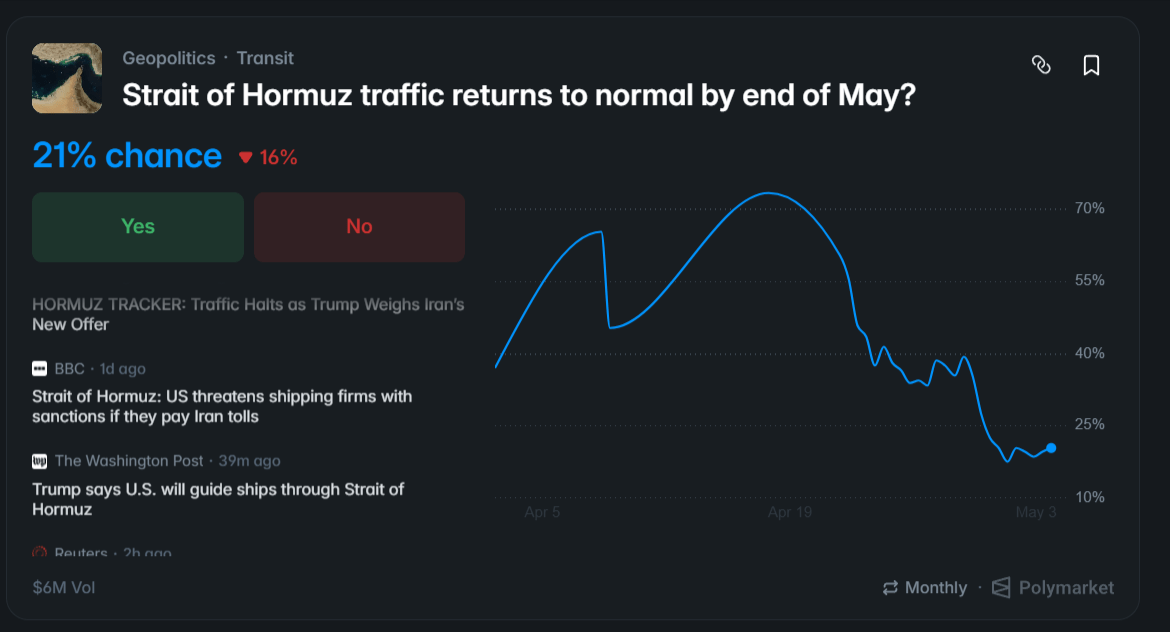
Switching gears to the macro picture, the naval blockade of Iranian ports is still tightening the world’s oil supply. We have seen Brent crude swinging wildly between $95 and $119 per barrel over the last month. The U.S. economy is holding up well thanks to deregulation and strong domestic production, but the threat of a major supply shock in the Strait of Hormuz is the big risk hanging over us for May. To address this, President Trump announced Project Freedom today, which uses naval destroyers and aircraft to escort commercial ships through those dangerous waters. Iran has already rejected this move, calling it a breach of ceasefire terms. Because of this friction, the odds of shipping traffic getting back to normal by the end of the month have crashed from 70% down to just 21%.
As we look ahead, the combination of tax cuts and deregulation is clearly the main engine driving these record highs. Even though our momentum gauges have turned positive for the month, the lack of participation from the average stock means we should stay invested but keep our positions liquid. We are watching the 7,130 level on the S&P 500 closely, as any further trouble in the Persian Gulf could send us back down to test that support very quickly.
Last Week Performance by Sector
Environmental & Specialty Materials: Rare Earth (+10.25%) leads the entire board, reflecting the ongoing strategic premium on critical minerals tied to defense, EV, and renewable supply chains. Biofuels (+11.88%) and Indoor Farming (-0.60% but in green-adjacent context) round out a strong agriculture-tech showing.
Education Tech: Platforms (+12.06%) and Software (+7.06% in Education) suggest a rotation back into digital learning names, possibly on enrollment data or AI-tutor adoption catalysts.
Telecommunications 5G (+7.82%): A meaningful move in infrastructure-heavy telecom suggests capex cycle optimism.
Clean Energy Pockets: Hydrogen (+4.24%), Wind (+2.14%), and Biofuels (+7.65%) are firmly green, breaking the multi-year underperformance trend in renewables.
AI-adjacent software; Edge (+6.65%), H-SaaS (+6.17%), DevOps (+7.06%), and AI Platforms (+2.83%) are holding up, though AGI itself is only +0.06%, suggesting a maturation from speculation to monetization names.
Precious & Industrial Metals: Gold (-8.12%), Silver (-5.21%), Precious (-6.13%). A sharp drop across the precious complex typically signals one of two things: a strong dollar/risk-on rotation, OR profit-taking after a major run. Combined with relatively contained equity weakness, this looks like rotation OUT of safe havens.
Semiconductors: Packaging (-8.25%), Next-Gen (-12.29%), Design Tools (-5.99%), Foundries shows mixed (+7.71% but volatile). The semi space is bifurcating, leading-edge stress while some foundries hold up.
Healthcare & Biotech: Healthcare (-6.36%), Oncology (-2.26%), Diagnostics (-0.24%), Devices (-5.00%). Broad weakness here, possibly policy/pricing related.
Consumer Discretionary Pockets: Luxury (-2.60%), Apparel (-1.66%), Grocery (-3.69%), Music (-0.48%). Consumer softness is showing.
Crypto & Blockchain: Mining (-3.50%), Infrastructure Tokenization (-2.59%), Blockchain (-1.70%). Risk-off in crypto despite equity resilience is notable.
We are seeing a very clear shift in where the big money is moving right now, and the headline is a major rotation out of defensive safe havens and directly into cyclical and infrastructure growth. Investors are stepping away from gold, healthcare, and consumer staples like groceries and apparel to fund bets on real assets and industrial commodities. Specifically, we saw oil climb 3.5% and gas jump 4.1% over the past week, while broader materials rose by 3.4%. There is a really strong appetite for specialty materials too, with rare earth elements surging by 10% as the market focuses heavily on supply chain themes.
The way this risk is being managed is actually quite nuanced. We aren’t seeing a blind rush into high-risk stocks; in fact, the most aggressive names in biotech and crypto have been relatively weak. Instead, the strength is concentrated in mid-beta cyclicals that have structural tailwinds behind them, such as energy, education tech, and infrastructure software. This looks much more like a late-cycle reflation trade than the typical early-cycle excitement we see when a new bull market starts.
When we look at the key insights for your portfolio, the combination of surging energy prices and falling gold suggests that inflation expectations are firming up once again. It is also fascinating to see how the tech trade is evolving. While the big-name semiconductor companies that build the hardware are showing some weakness, AI software companies are holding steady. This tells us that investors are starting to differentiate between the companies that build AI infrastructure, which might already be fully priced, and the companies actually deploying AI to make money, which are still seeing their valuations climb.
Finally, we have to talk about the broad weakness across the healthcare sector. It is rare to see almost every sub-sector in healthcare fall at the same time without some kind of major policy shift or interest rate catalyst lurking in the background. Between the strength in rare earths and materials and this unusual healthcare slump, the market is sending a loud signal that it is prioritizing the supply chain and real-world assets over traditional defensive plays.
Earnings Outlook
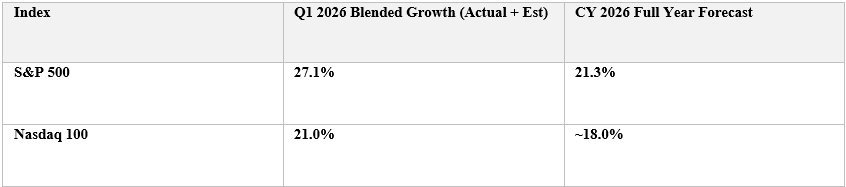
We’re seeing a corporate earnings season that is honestly full of surprises, with actual results coming in way ahead of what analysts expected. While the main market indices look like they are accelerating at full speed, a closer look shows a widening gap between the AI-powered leaders and the rest of the market. The S&P 500 is currently on track for a blended growth rate of 27.1%, which is its highest growth since 2021 and a huge jump from the 13.1% that analysts were originally calling for. The Nasdaq is also showing strength with 21.0% growth, even as it faces tougher comparisons following its massive gains over the last two years. This matters because it shows the market’s high valuation, with a forward P/E of 20.9x, is actually being supported by real cash flow rather than just pure speculation.
Earnings Outlook: S&P 500 & Nasdaq
When we look under the hood at the Magnificent 7 versus the rest of the market, the divergence has reached a critical point. These seven tech giants are tracking at 61.0% growth for the first quarter, but the other 493 stocks in the S&P are only growing at about 10.1%. To give you an idea of how much NVIDIA is driving this, if you take them out of the equation, the growth rate for that top group drops from 22.8% down to just 6.4%. This tells us that the idea of the “average” stock catching up to tech is still mostly a myth, and the market is still heavily reliant on a few AI giants.
Earnings Outlook: S&P 500 & Nasdaq
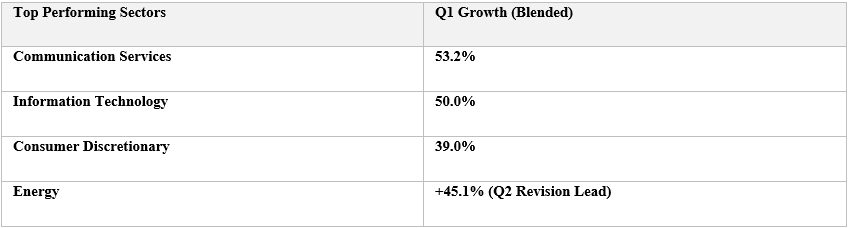
What is really unusual right now is that earnings forecasts are actually accelerating. Since the end of March, full-year estimates have been revised upward by 3.4%, which almost never happens because analysts usually get more conservative as the year goes on. Communication Services and Information Technology are leading the way with growth rates of 53.2% and 50.0% respectively. We are also seeing a massive surge in Energy, where second-quarter revisions are up 45.1% due to the Iranian port blockades and rising oil prices. Meanwhile, Industrials are lagging behind with a -2.9% revision as global shipping friction and higher costs start to bite.
This means growth is very concentrated in digital productivity and real assets while middle-of-the-road sectors are feeling the squeeze of macro volatility. For investors, this suggests that holding energy exposure might be a smart move, especially since energy estimates for the full year have been revised up by 27%, acting as a hedge against trouble in the Middle East. Overall, the bull market is healthy, but it is incredibly top-heavy. For this rally to stay sustainable through the second half of the year, we really need to see the rest of the market move from that 10% growth range toward 15% or 20%. Until that happens, the best move is to stay concentrated in the current winners while keeping a very close eye on your laggards.
Valuations
Looking at the headline indexes, the S&P 500 is currently trading at a forward twelve-month P/E ratio of 20.9x. This sits above both the five-year average of 19.9x and the ten-year average of 18.9x. So, what does this mean? It means the broader market is trading at a notable premium. Any macroeconomic shock or downward revision in late-year earnings estimates could trigger a swift multiple compression. Turning to the Nasdaq 100, we see it is trading at an estimated forward P/E of 26.8x, reflecting the heavy concentration of tech and communications equities. So, what is the takeaway here? Tech and consumer discretionary dominance continues to command a steep growth premium. However, this multiple requires these heavyweights to sustain double-digit earnings growth.
To accurately assess the market, we have to isolate the mega-cap tech cohort from the rest of the benchmark. Given the S&P 500 forward P/E of 20.9x, and the Magnificent 7 currently trading at a forward P/E of 26.1x while comprising approximately 30.0% of the index weight, we can calculate the valuation of the remaining stocks. Solving for the unknown gives us a forward P/E of 19.3x for the S&P 500 excluding the Magnificent 7.
Looking closer at the Magnificent 7 forward P/E of 26.1x, we see valuations here have slightly cooled from recent peaks but remain elevated. So, what? The law of large numbers is catching up. Their year-over-year earnings growth rates are decelerating as they face tougher comparisons, meaning their ability to single-handedly carry index performance is waning. Meanwhile, the remaining market sits at a forward P/E of 19.3x, trading much closer to its historical baseline. So, what is the bottom line? There is a two-tiered market. The underlying S&P 493 presents a much more reasonable entry point for valuation-sensitive investors, offering a margin of safety that the headline index masks.
Forward P/E Multiples by Sector
Shifting focus to the earnings denominator, the first-quarter reporting season is coming in exceptionally strong. With over 60.0% of companies reporting, the blended year-over-year earnings growth rate for the S&P 500 is tracking near 27.1%. If this holds, it will be the highest growth rate since late 2021. So, what is the significance? The market’s elevated P/E ratio is currently supported by actual denominator expansion through earnings beats rather than purely speculative numerator expansion from price run-ups. This means the valuation, while high, is grounded in strong fundamental corporate performance.
There are two main takeaways here. First, the earnings rotation is underway. The Magnificent 7 accounted for the vast majority of net earnings growth over the last two years, but that dynamic is shifting. The relative contribution to overall S&P 500 earnings growth from the other 493 companies is expanding. Market breadth will likely widen. The heavy concentration risk in passive index funds makes them vulnerable if the tech mega-caps stall, but an equal-weight S&P 500 strategy should fundamentally benefit from this underlying earnings catch-up.
Second, there are margin peaking risks. Profit margins for top-tier tech have pushed into the mid-20.0% range, setting all-time highs. Margins are notoriously mean-reverting. Even minor margin compression due to rising capital expenditures for infrastructure or regulatory pressures could disproportionately hit the bottom line of the mega-caps, sparking a valuation downgrade.
Analyst S&P 500 Price Targets
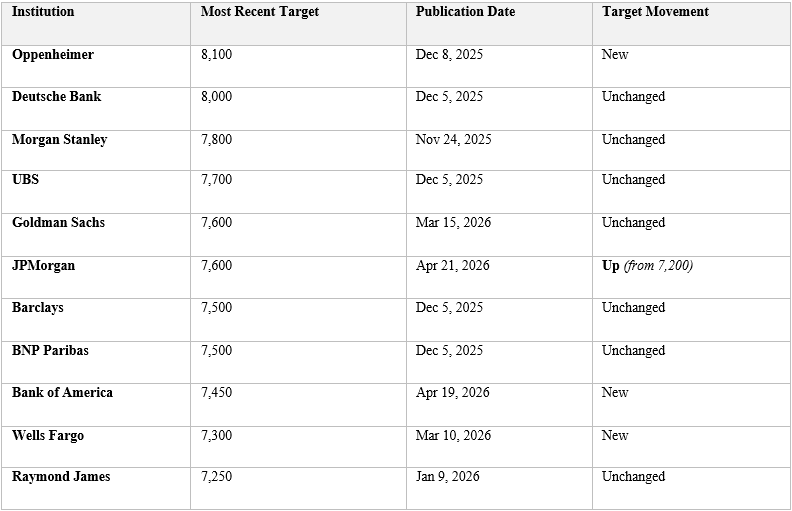
Dividing this sum by the number of estimates, the new average S&P 500 target is 7,618.
The spread between our most bullish target (Oppenheimer at 8,100) and our most bearish (Raymond James at 7,250) is now a substantial 850 points, or nearly a 12% divergence from top to bottom. This is significant disagreement on the Street regarding valuation multiples. Bulls like Oppenheimer are underwriting aggressive multiple expansion (26.5x) based on peak earnings, while bears are modeling in severe margin compression and delayed macroeconomic lag effects. This wide spread means volatility is likely as the market battles between these two distinct thesis paths.
Sentiment Analysis
To accurately assess the psychology of the market right now, we have synthesized data across retail surveys, institutional positioning, and options market pricing.
Let us start with sentiment surveys and market psychology. Looking at the American Association of Individual Investors Sentiment Survey, the latest data shows bullish sentiment sitting at 49.5%. This is significantly above the historical average of 37.5%. Meanwhile, bearish sentiment has plummeted to just 21.0%. So, what does this actually mean? It tells us that retail investors are highly confident the market will continue to climb. Historically, extreme readings in this survey act as a contrarian indicator. When the crowd is unanimously positioned on one side of the boat, the market becomes highly susceptible to a reversal if any negative catalyst emerges.
Moving over to the Fear and Greed Index, composite sentiment models are currently registering a score of 78.0 out of 100.0. This places the market firmly in extreme greed territory, largely driven by strong market momentum and high demand for junk bonds over safe-haven treasuries. So, what is the takeaway here? Momentum, rather than fundamental valuation, is the primary driver of capital flows right now. This extreme greed signals that buyers are willing to overlook the elevated 20.9x forward price-to-earnings multiple we discussed earlier.
Now let us transition into options and volatility metrics. We will start with the CBOE Volatility Index, commonly known as the VIX or the market fear gauge. The VIX is currently suppressed and hovering right around the 12.5 level. So, what does a reading this low indicate? A VIX under 13.0 indicates complacency. The options market is essentially pricing in a remarkably smooth ride with very little anticipated turbulence over the next thirty days. Because of this, downside protection is currently historically cheap to purchase.
Next, we look at the equity put-to-call ratio, where the five-day moving average has dropped to 0.6. So, what does this tell us? A ratio below 0.7 shows that traders are aggressively buying call options to bet on prices going up, while largely ignoring put options that act as insurance against prices going down. This confirms rampant speculative behavior where investors are maximizing their leverage to chase upside rather than hedging their portfolios.
Interestingly, when we look at the CBOE Skew Index, which measures the pricing of deep out-of-the-money options, we see it is elevated at 145. So, what is the implication of this divergence? While retail traders and the headline VIX show complacency, institutional smart money is quietly paying a premium for extreme tail-risk protection. They are actively buying black swan insurance just in case the market experiences a sudden and severe drop.
Let us wrap up with the key insights and actionable implications for active investors. The primary insight here is that we are in a fragile Goldilocks environment. While strong corporate earnings are providing fundamental cover, the psychological stretching is currently extreme. So, what should you make of this? When greed is high, the VIX is low, and retail money is heavily skewed bullish, the threshold to disappoint the market becomes dangerously low. The current environment leaves zero margin for error regarding inflation data, Federal Reserve policy, or tech sector earnings delivery.
The first actionable implication is to harvest volatility and hedge cheaply. Active investors must never mistake low volatility for low risk.
The second actionable implication is to trim your high-beta winners. Momentum is stretching valuations in the most crowded trades, particularly within the tech sector. So, what should you do about it? Active investors need to recognize this extreme greed signal and systematically trim profits from their highest-flying, high-beta equities. By reallocating those gains into discounted, low-volatility value sectors like Financials and Energy, you can lock in profits while maintaining market exposure at a significantly lower risk profile.
Money Flow & Trend Strength
Moving to accumulation and distribution, we look at the Chaikin Money Flow. The data shows this indicator held above positive 0.2, but it flattened out over the last three trading days. So, what does this tell us? It means institutional capital is still supporting the 7,200 level, but the influx of new buying pressure is finally starting to stabilize.
Next, we evaluate momentum using the Average Directional Index. The fourteen-day index recently surged to 35.0, with the positive directional indicator trading cleanly above the negative one. So, what is the takeaway here? A reading of 35.0 confirms overwhelming bullish momentum. Because of this strength, shorting this entrenched trend based purely on valuation is extremely dangerous right now.
Now, let us examine the dark pool prints. Dark pool volume just exceeded 45.0% of total market volume, and we noticed massive print clusters executing just beneath the 7,250 mark. So, what does this mean for you? It indicates that institutional smart money is quietly distributing shares. They are locking in their profits by selling into retail liquidity, effectively masking a hollowing structural foundation beneath the broader market.
Your first move should be to trail your stops aggressively. You want to move your stop-losses tightly beneath the 7,100-support zone. So, what is the benefit? This strategy protects you against a sudden, dark-pool-driven rug pull while still letting that powerful momentum carry your remaining long profits higher. Your second move is to watch closely for volume divergences. Specifically, you should monitor the money flow if the index pushes to new highs above 7,300. So, what happens then? If the market hits 7,300 but the money flow turns negative, it confirms heavy distribution. This divergence will provide you with a precise signal to initiate your downside hedges.
Bond Yields & Credit Spreads
Let us move on to the most important bond yield data, starting with yield curve spreads. The spread between the ten-year and two-year Treasury yields is currently positive at 0.5%. So, what does this mean? It means the yield curve is normal and upward sloping. We are moving decisively away from the inverted levels that typically signal recessions. This shift reflects strong market conviction in sustained long-term economic growth. Looking at the spread between the ten-year and three-month Treasuries, we see it is also positive at 0.7%. So, what is the takeaway here? This confirms the previous data and indicates that short-term liquidity is relatively cheap compared to long-term growth expectations. Ultimately, this creates a highly supportive environment for bank lending and corporate expansion. Over the past week, this normalized yield curve heavily influenced the market by reinforcing a Goldilocks economic narrative. So, what was the actual impact? Because the bond market is actively pricing out recession risk, institutional capital flowed aggressively out of safe-haven Treasuries and straight into equities. This rotation directly supported the upward momentum of the S&P 500 toward the 7,230 level.
Now, let us analyze high yield spreads. These junk bond spreads are currently sitting at 2.8%, steadily narrowing from the 3.5% peak we saw in late March. So, what does this indicate? It tells us we are in a definitive risk-on regime. A spread beneath 3.0% is historically tight. This means investors are demanding extremely low risk premiums to hold low-tier corporate debt, purely because they have absolute confidence that corporate defaults will remain near zero. Looking at the broader bond market implications, we can see that credit markets are essentially priced for perfection. So, what is the danger here? With spreads this compressed, the upside for bond buyers is virtually non-existent, but the structural downside risk is massive. Any unexpected economic shock, inflation spike, or slight uptick in corporate bankruptcies will cause these spreads to violently widen. Historically, this widening acts as the first domino to fall before a major equity market correction. Active investors should absolutely view this tight spread as a glaring warning sign of peak market complacency.
Macro Notes on the U.S Economy
Let us start with inflation, which is continuing its downward direction. The headline Consumer Price Index has cooled to approximately 2.4% year-over-year, steadily decelerating toward the 2.0% target set by the Federal Reserve. Core consumer prices, which strip out volatile food and energy costs, remain slightly stickier but are still tracking downward. So, what does this actually mean? It means the prolonged battle against inflation is largely succeeding. This is great news for consumers as cost-of-living pressures begin to ease. However, for investors, it signals that corporate pricing power is diminishing. Companies can no longer simply raise their prices to mask lower sales volumes. Going forward, future earnings growth must come from actual consumer demand and strong operational efficiency.
Next, let us look at interest rates and Federal Reserve expectations. The direction here has plateaued, with expectations for future decreases. Currently, the Federal Funds Rate sits at a target range of 3.5% to 3.8%. Looking at market expectations, traders anticipate the Fed will hold rates steady in the immediate term, with a gradual easing cycle priced in for the back half of the year. So, what is the takeaway? The Federal Reserve has successfully orchestrated a higher-for-longer environment, allowing borrowing costs to finally stabilize. While this provides a predictable baseline for corporate debt refinancing, holding rates unchanged means capital remains relatively expensive compared to the zero-interest-rate era. As a result, highly leveraged companies will continue to face serious margin pressure as their older, cheap debt matures and must be refinanced at these higher rates.
Turning to the labor market, we are seeing a general softening direction. The unemployment rate has ticked up slightly to 4.1%, while recent non-farm payrolls showed a moderate but cooling increase of roughly 160,000 jobs. So, what does this data tell us? The labor market is loosening just enough to prevent a wage-spiral inflation shock, but not enough to trigger mass layoffs. We are essentially in a Goldilocks labor environment. This delicate balance gives the central bank perfect cover to pause rate hikes. However, it also implies slightly weaker consumer spending power in the coming quarters as the era of aggressive job hopping and massive wage increases begins to slow down.
Moving on to recession dangers and recent market movers, United States gross domestic product growth remains positive, but leading indicators like manufacturing purchasing managers indexes have remained quite sluggish. Recently, weaker-than-expected retail sales data moved the market significantly, triggering a slight rotation out of consumer discretionary stocks. So, what is the implication here? An immediate, deep systemic recession is currently a low-probability event. Instead, we are experiencing more of a rolling slowdown. The danger is no longer a catastrophic economic collapse, but rather a slow bleed in corporate profit margins as the everyday consumer finally pulls back on discretionary spending.
Asset Recommendations for this Regime
Let us talk about how to actually position your portfolio right now. A balanced approach would lean toward energy and materials to give you necessary exposure to inflation and supply-chain dynamics. You should also focus on selective artificial intelligence software, specifically areas like development operations, edge computing, and hybrid software-as-a-service, rather than focusing purely on hardware. Clean energy names are showing some fresh momentum, so those are worth keeping on your radar. When it comes to precious metals, you should only trim your positions into the current weakness if you strongly believe the recent dollar strength will persist. If you do not believe that, the sheer magnitude of the recent drop actually makes this a prime buying opportunity in gold. Additionally, you want to avoid leading-edge semiconductors until the current market bifurcation resolves, and you should definitely remain cautious on consumer discretionary stocks.
To navigate this complex environment effectively, consider overweighting the broader market through an equal-weight strategy. You can do this by shifting a portion of your passive, market-cap-weighted index exposure into equal-weight S&P 500 exchange-traded funds, or by actively selecting high-quality mid-cap companies. So, what is the actual benefit here? This specific move allows you to capture the ongoing earnings rotation. More importantly, it means you are buying the market at a much cheaper 19.3x multiple instead of the headline 20.9x multiple. This drastically reduces your overall exposure to a potential tech-led multiple contraction down the road.
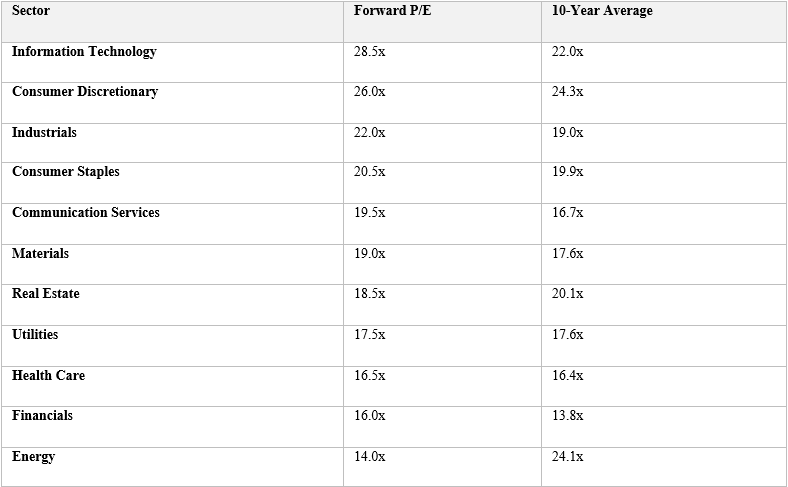
Another strong approach is employing a barbell strategy. This involves blending growth at a reasonable price with deep value investments. You can safely maintain your core holdings in cash-rich technology companies, but you want to pair them aggressively with deeply discounted value sectors. Specifically, we are looking at Financials currently trading at a 16.0x multiple and Energy sitting down at a 14.0x multiple. So, what does this accomplish for your portfolio? It perfectly hedges you against sudden sector rotations. If the tech sector stumbles, your downside in these structurally cheap value sectors is highly limited. Plus, their dividend yields offer a steady cash buffer while you wait patiently for capital appreciation.
Momentum opportunities for the week can be found here – Link
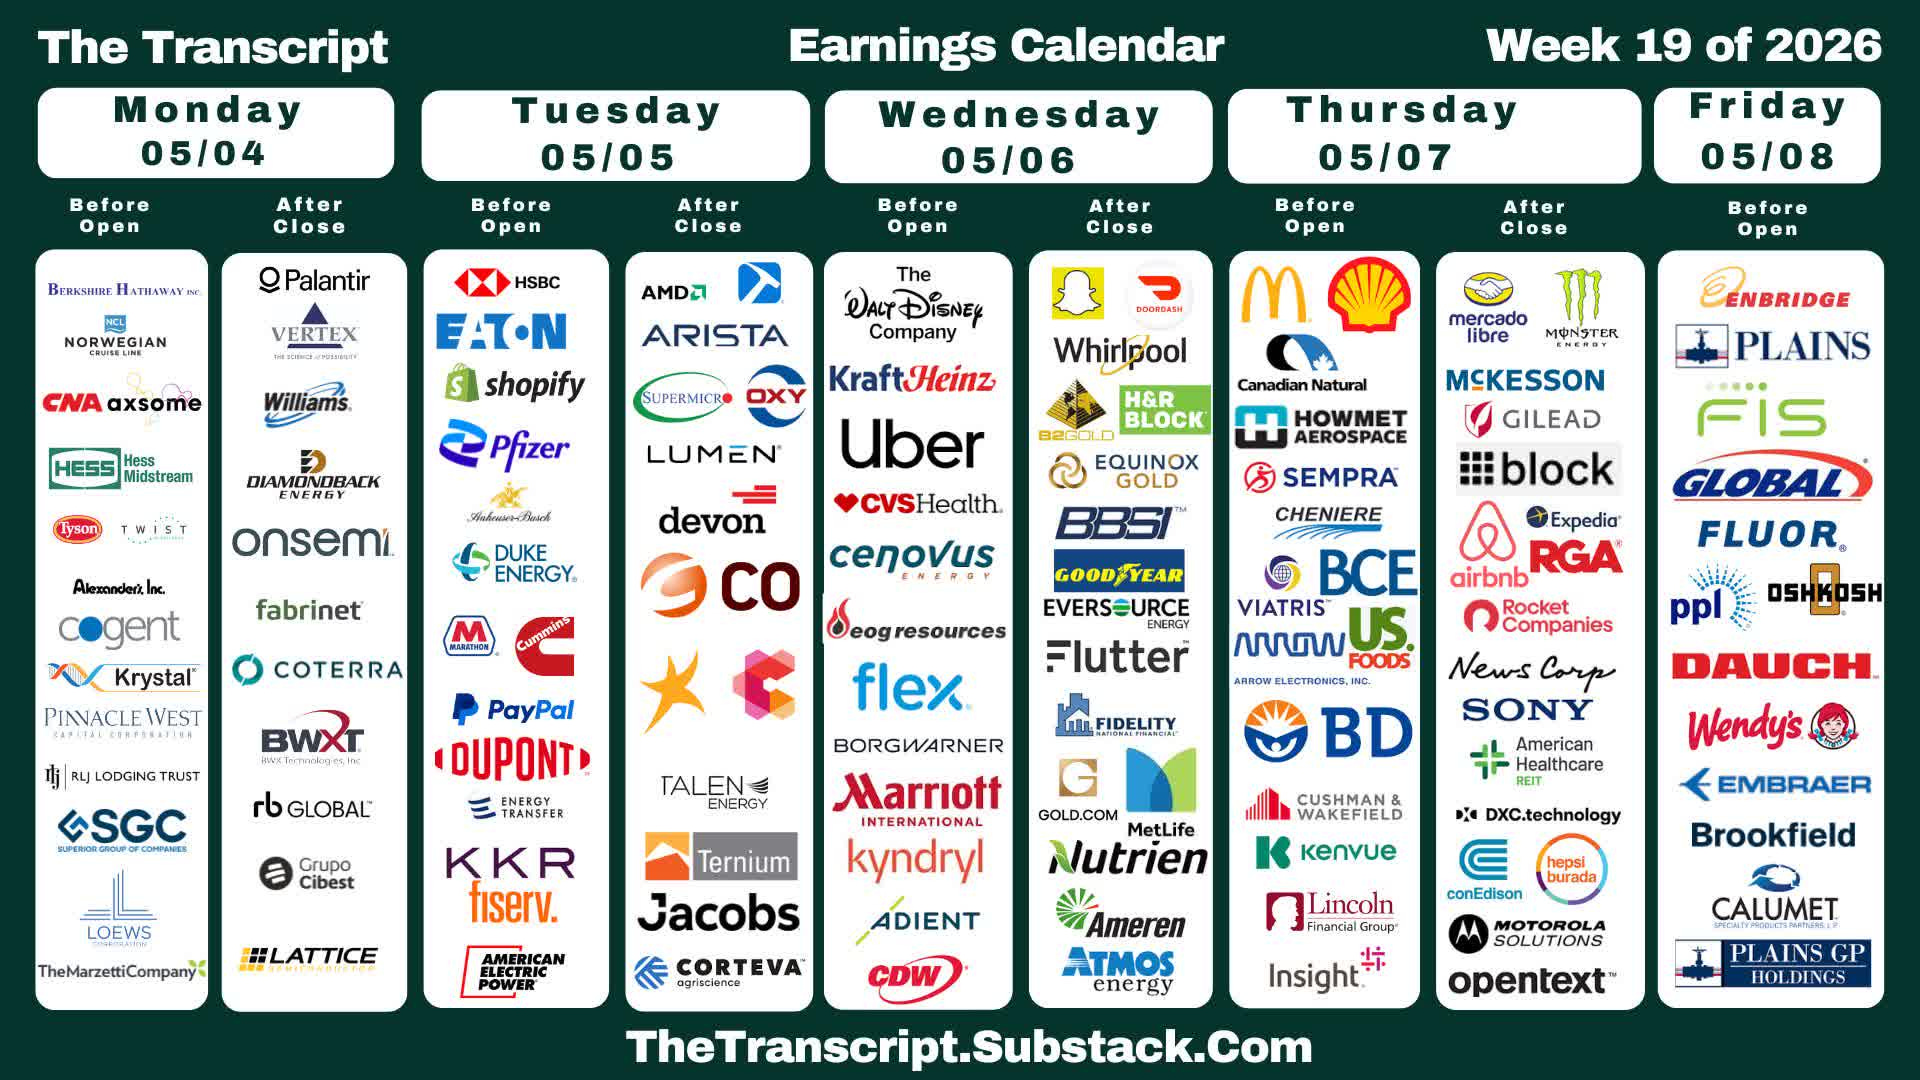
U.S. Upcoming Earnings
Next week will be quite important for earnings reports in the tech sector. The economic calendar is not too heavy, but we do have some job numbers and ISM indicators on the agenda. The situation in Iran and its impact on oil prices, in turn, on inflation expectations and interest rates, remains a top concern for the market.
Recent Analyst Price Hikes and Institutional Buying
We have seen some significant shifts in how the major analysts are valuing top-tier stocks and where the smart money is moving right now.
- Most recent Analyst Price hikes – Link
- Most recent Institutional buys – Link
Bottom Line
The S&P 500 trades at a premium 20.9x forward P/E, driven by strong Q1 2026 earnings growth near 27.1%. However, isolating the S&P 493 reveals a discounted 19.3x multiple, indicating a nascent earnings rotation. Driven by bearish capitulation (including JPMorgan’s upgrade), the new Street consensus target sits at 7,618, meaning the index is priced for perfection.
Cooling headline inflation (2.4%), a softening labor market, and a decisively un-inverted yield curve have pushed market psychology into “Extreme Greed.” With the VIX suppressed near 12.5 and high-yield credit spreads historically tight at 2.8%, the market is demanding zero risk premium and is highly vulnerable to multiple compression.
Surface-level momentum masks structural fragility. Domestic “shadow QE” (banks absorbing debt) is temporarily offsetting the Fed’s liquidity drain, but simultaneous U.S. Dollar and Japanese Yen strengthening flashes a severe offshore global liquidity warning. Concurrently, dark pool prints exceeding 45% of total volume confirm institutional “smart money” is quietly distributing shares just beneath all-time highs.
Hedge: Tighten trailing stops and exploit the 12.5 VIX to purchase historically cheap downside put options.
Equal-Weight: Shift passive exposure into equal-weight S&P 500 strategies to bypass mega-cap concentration and capture the cheaper 19.3x broader market multiple.
Barbell Allocation: Pair cash-rich tech core holdings with deeply discounted, high-yield value sectors like Energy (14.0x P/E) and Financials (16.0x P/E) to buffer against sector rotation.
Disclaimer
This report is provided strictly for informational purposes and does not constitute financial advice, an offer to sell, or a solicitation to purchase any securities. The author may hold a position in securities discussed. The analysis reflects independent research conducted without external compensation or existing business relationships with the mentioned entities. Please be advised that investing involves significant risk, and past performance is never a guarantee of future market results. Readers should conduct their own due diligence or consult a licensed professional before making any investment decisions based on this data. All information is sourced from public filings and is considered current only as of 4th May 4, 2026.
Join the Value & Momentum Portfolio
Unlock weekly Market Pulse and Macro Notes, high-conviction Momentum Plays, and institutional-level Deep Dives on AI Infra, SaaS & Defense. + Analysts Upgrades & Rising price targets + Insider & Institutional Buys + Sweep Calls above Ask + 2nd Derivative Analysis by Sector.
Get the edge you need, led by former investment banker Denis D. (Lazard, Rothschild), our research helps you stay ahead of the curve. Subscribe to start your analysis now - @X: Link, @Seeking Alpha: Link, @Spotify: Link, @Youtube: Link.