
The Global E-Commerce Blueprint: How Amazon, MercadoLibre, and Sea Limited mirror each other at Different Scales.
From Growth to Maturity: A Look at Amazon, MercadoLibre, and Sea Through the Same Strategic Lens.

Start with the question that almost nobody asks honestly. Are these three companies even comparable? The short answer is yes on architecture, no on substance. And that gap is the entire reason this piece is worth writing.
What is genuinely similar across Amazon, MercadoLibre and Sea Limited is the architecture of the flywheel. All three run the same five-part playbook. A third-party marketplace as the demand spine. Owned logistics as the What is genuinely different is everything underneath the architecture. Amazon is a developed-market hyperscaler whose actual profit pool is AWS, a cloud business with no equivalent at the other two. The retail-and-logistics empire is the wrapper. MELI is an emerging-market marketplace with a credit-warehousing fintech bolted on. Mercado Pago carries lending risk on its own balance sheet, in a high-rate Latin American macro, and that single fact reframes the whole financial profile. Sea is a Southeast-Asian-and-LatAm marketplace funded by a high-margin gaming engine in Garena that has no parallel at Amazon or MELI, paired with a fintech credit book that mirrors Mercado Pago’s mechanic at half the scale and a fraction of the disclosure. Different geographies. Different profit-pool composition. Different funding sources. Different risk categories.
That mismatch matters because the three names get treated as cross-comparable on multiples, SE trades at a 35% EV/EBITDA discount to MELI, MELI trades at a 20-something multiple, Amazon at a discount to the mega-cap cohort and the multiples imply they are running the same race. They are not. They are running the same shape of race, on three different tracks, at three different points in the lap. Amazon is exiting its capex cycle and has been re-rating upward. MELI is entering its capex cycle and has been re-rating downward. Sea is mid-cycle, with the cleanest cash engine of the three in Garena, the heaviest cash drag of the three in the SeaMoney loan book, and the steepest valuation discount.
These three are comparable as architectures and as flywheel mechanics. They are not comparable as profit pools or as risk categories. Where the comparison earns its keep is in showing which version of the same playbook has the cleaner cash conversion, the longer reinvestment runway, the higher pricing power, the better defenses against inflation and cycles, and the highest quality of earnings. Those five questions sit underneath every margin line and every multiple. The rest of this piece works them through. For additional information please consult respective deep dives on Value & Momentum portfolio on AMZN, MELI and SE Limited.
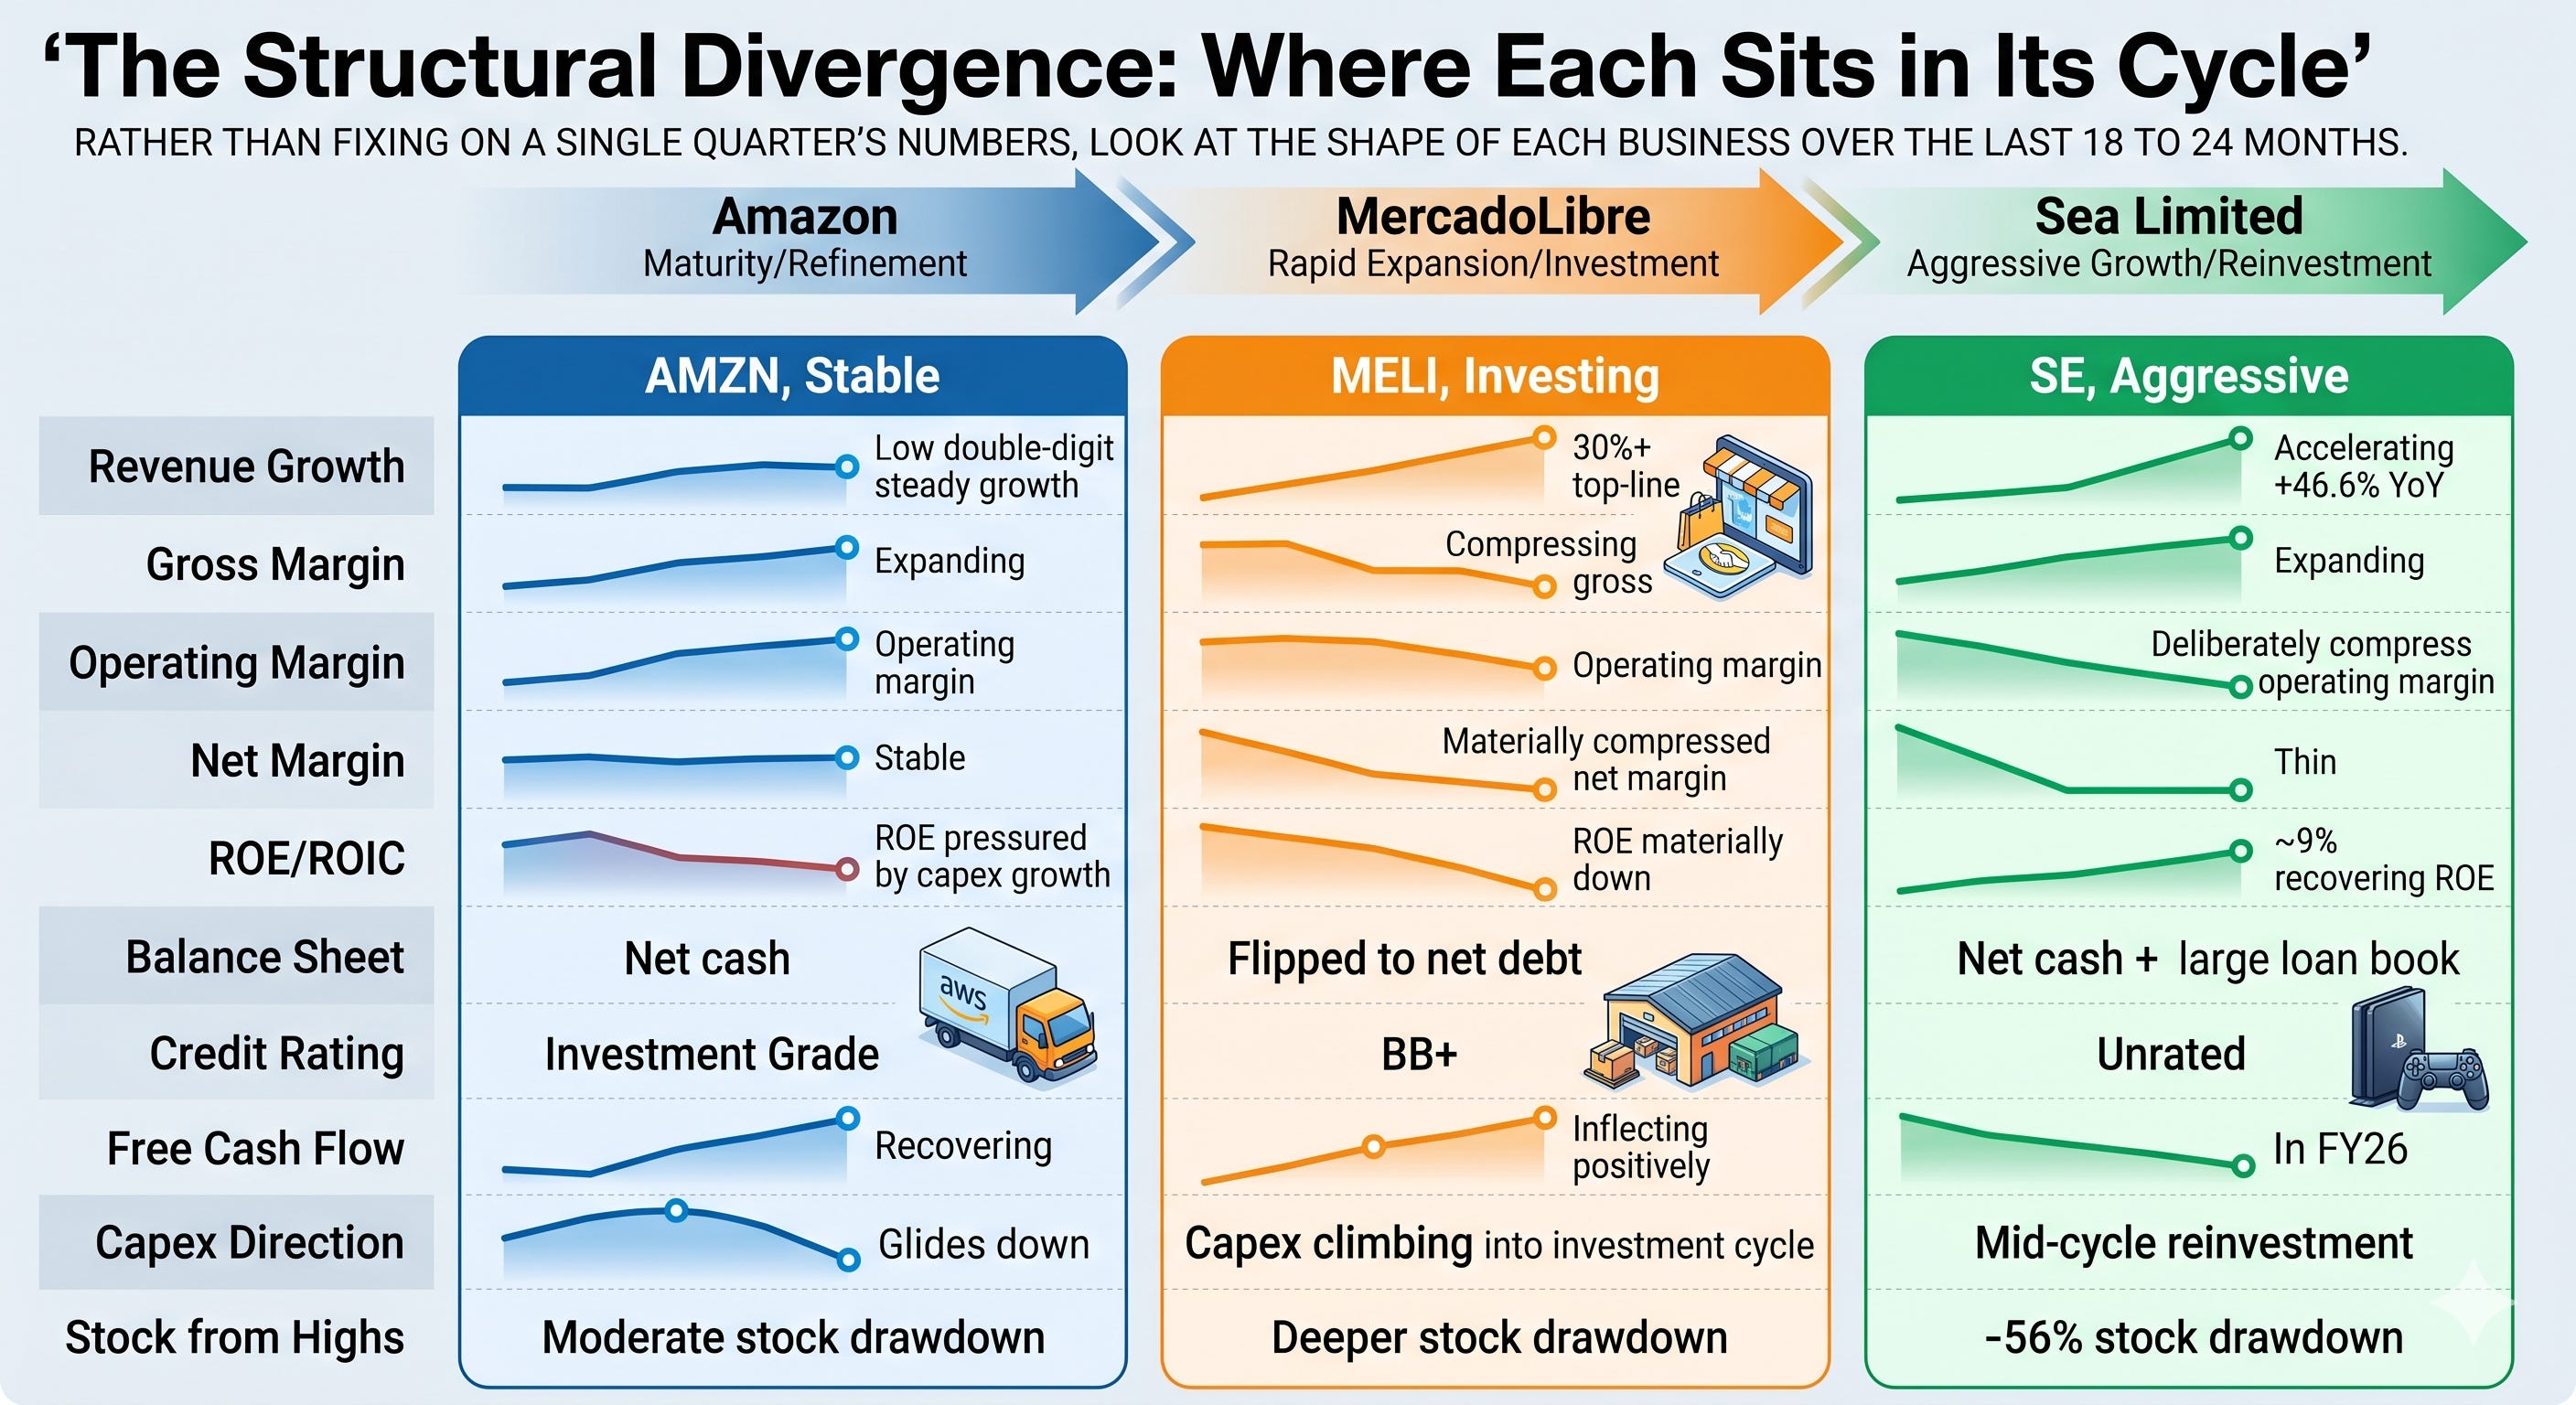
The Structural Divergence: Where Each Sits in Its Cycle
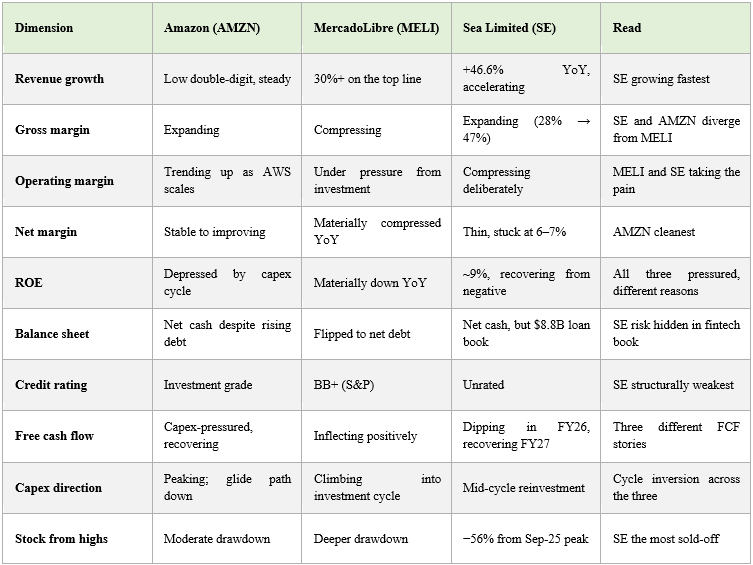
Rather than fixing on a single quarter’s numbers, look at the shape of each business over the last 18 to 24 months. Here is the takeaway. On every margin line that counts, these three are moving in different directions. Amazon’s profitability is grinding higher as AWS scales and the AI capex cycle starts showing up in revenue. MELI’s profitability is grinding lower, under deliberate investment. Free shipping. First-party inventory. Credit cards. Cross-border trade. Management has put a number on that drag. They have said it is costing them several percentage points of margin. Sea sits between the two. Gross margin is climbing structurally from 28% to a projected 51%, which is a quality signal Amazon and MELI cannot show. But Shopee’s segment EBITDA actually declined year-over-year in Q1 2026 to $223M from $264M even as revenue grew 44%. The compression is deliberate. The cash conversion sits at 0.98x for FY2026, below 1x, because the SeaMoney loan book is absorbing every incremental dollar.
That distinction matters for earnings quality. None of the three companies is hiding the compression. MELI tells you about it. Sea tells you about it. Amazon already lived through it. But disclosure does not change the math. And right now, the market is not willing to pay for the recovery story at MELI or Sea until the margin recovery actually starts to show up on the print.
The Five-Pillar Comparison
All three companies run the same architecture. Let’s walk through how each pillar stacks up across the three.
The Cash Engine: Cloud, Fintech, or Gaming
This is the pillar that matters most. Each company has a high-margin business sitting inside the retail wrapper that does the real work on profitability. The interesting twist is that all three engines are structurally different.
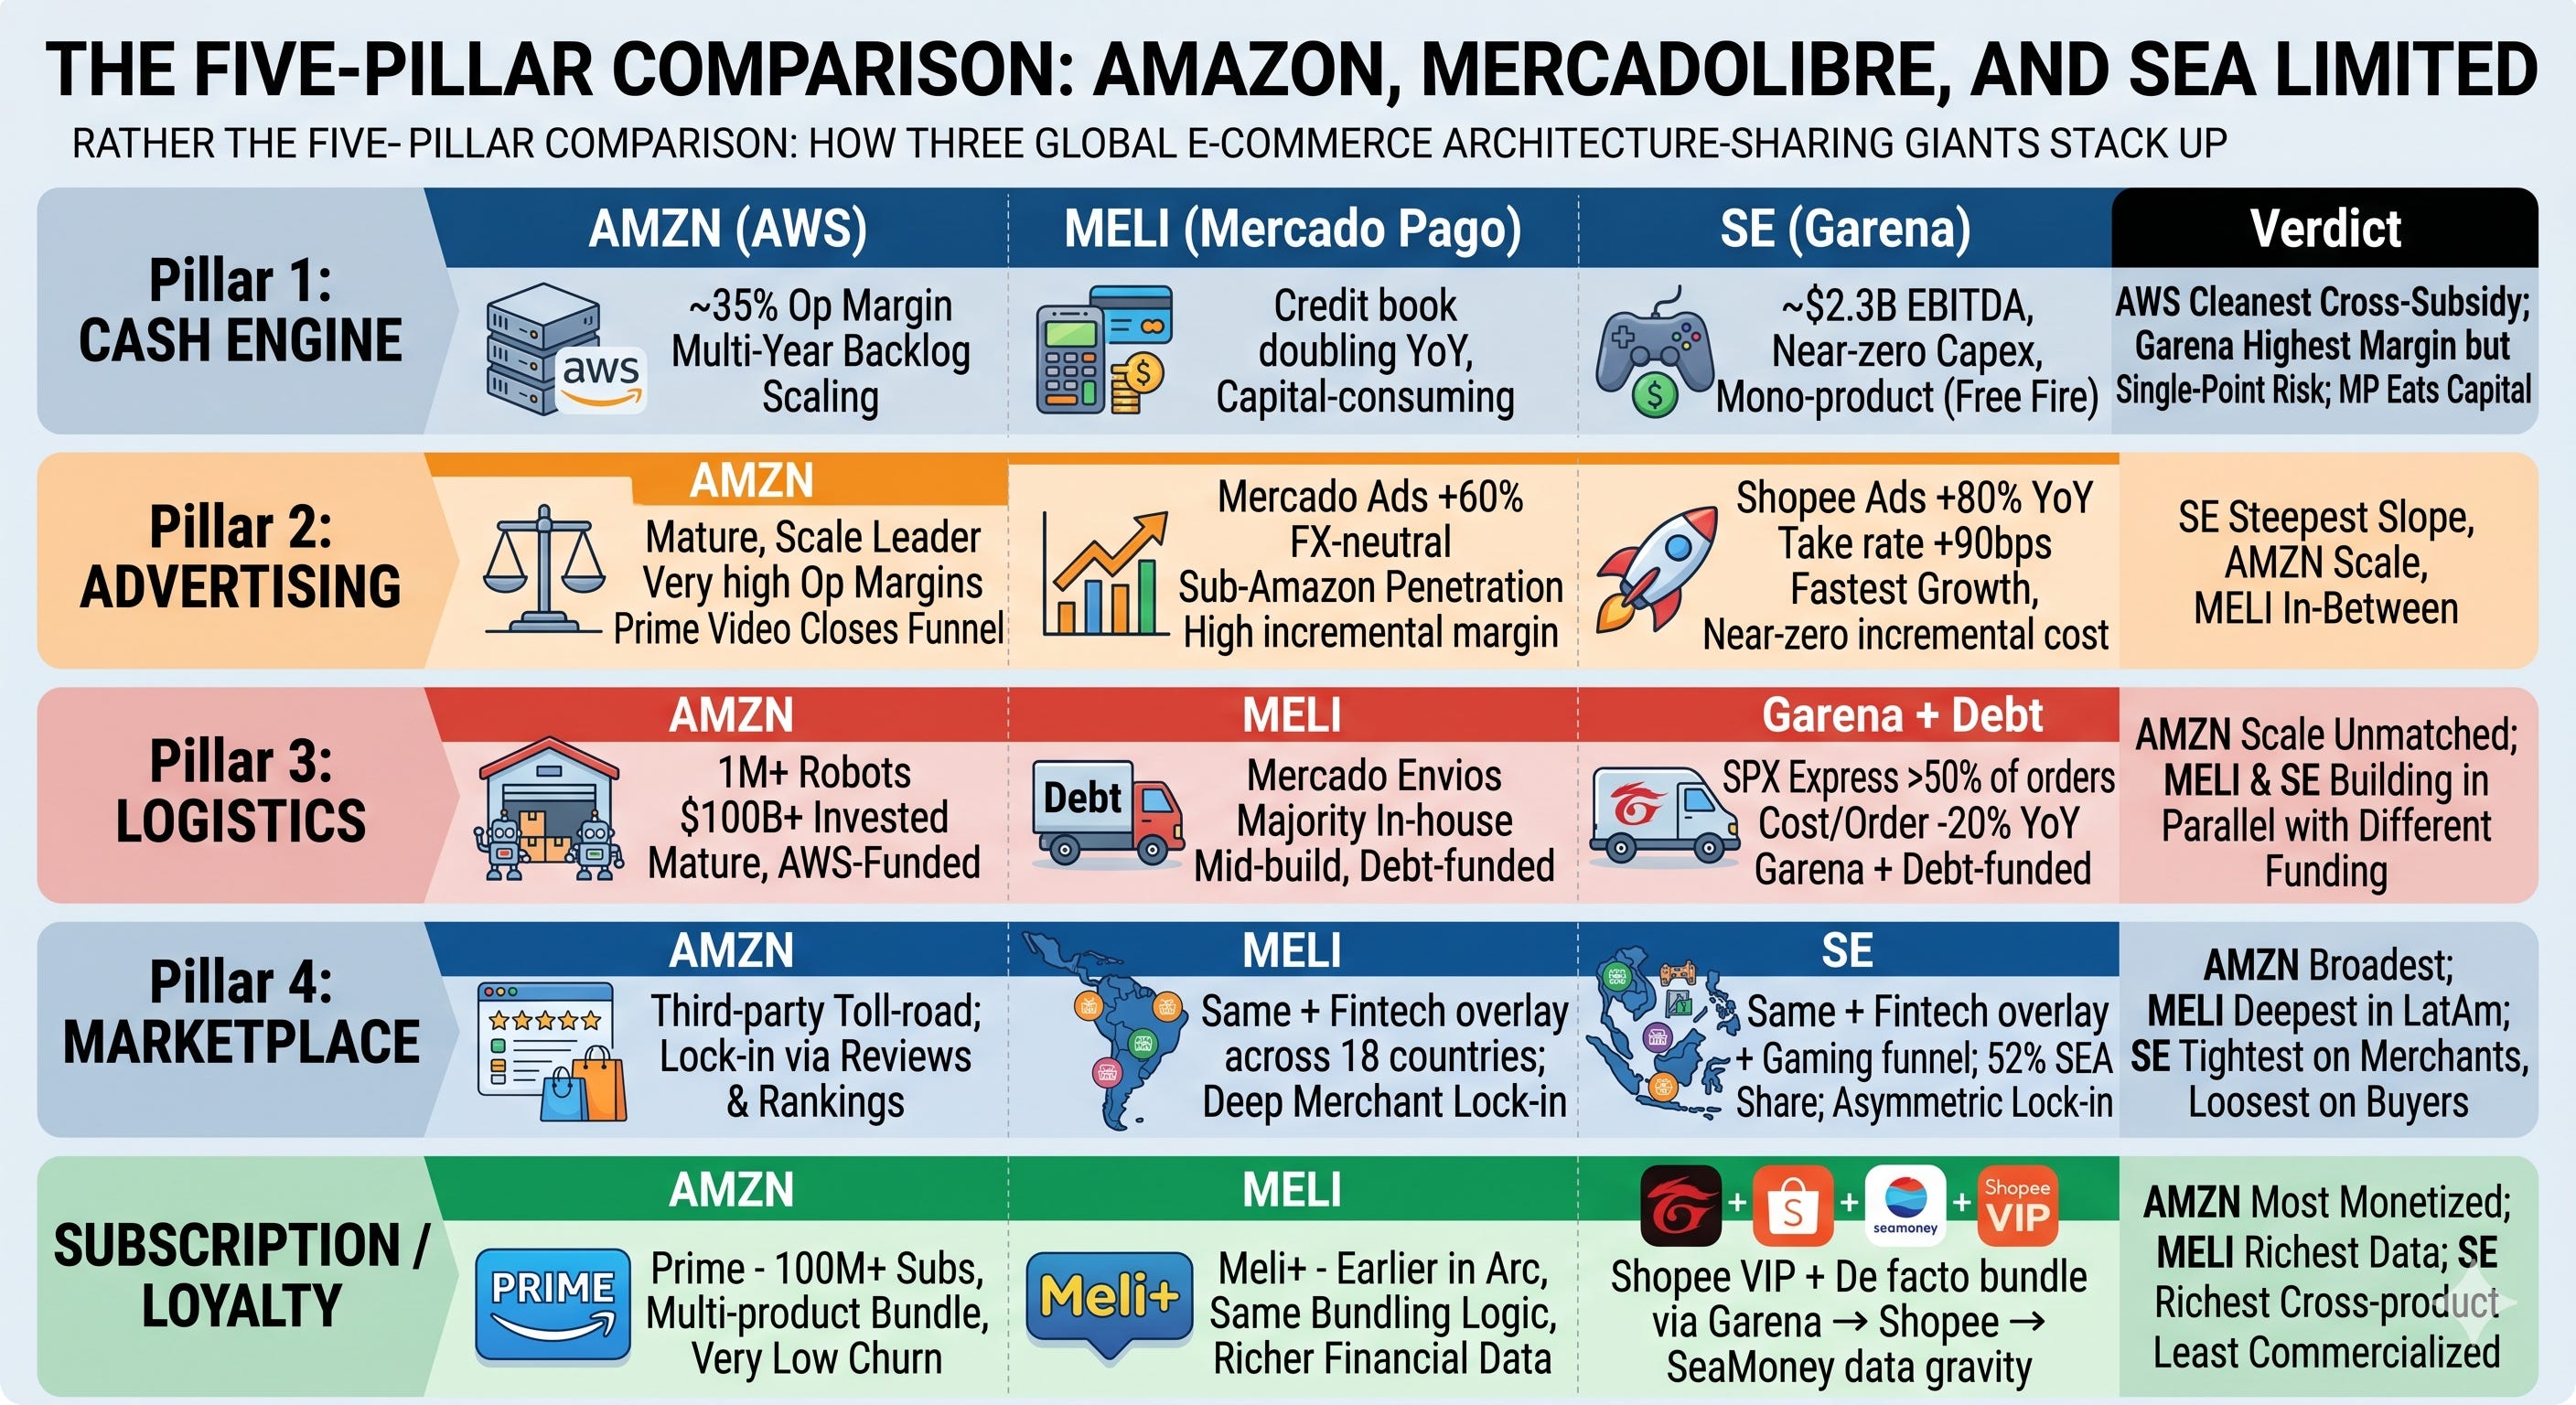
For Amazon, that’s AWS. Operating margin around 35%. A backlog of signed multi-year contracts that grew through 2025. A leading position in cloud infrastructure. If you value AWS plus the advertising business on standalone multiples, they justify Amazon’s entire market cap. Which means at the current price, you are getting the retail business, Prime, the international segment, and the future bets like Kuiper and Zoox for free.
For MELI, the equivalent engine is Mercado Pago. It’s a fintech that has scaled into a multi-billion-dollar business, with a credit portfolio that has roughly doubled in twelve months and assets under management growing even faster. Here’s the part that bulls keep coming back to. Nubank, which is a useful pure-play comparison, trades at around 8x price-to-sales. Inside MELI, Mercado Pago is being valued at roughly 3x. On a sum-of-the-parts basis, the fintech segment alone is worth more than MELI’s entire current market cap. The market is paying for the marketplace. You are getting the fintech thrown in.
For Sea, the cash engine is Garena, and it works in the opposite direction. Garena generates around $2.3B in trailing EBITDA on $2.8B in revenue, call it pure-margin gaming cash flow, around $574M in EBITDA per quarter with essentially no capex. That cash historically funded Shopee and SeaMoney through their build-out years.
Here’s where the three diverge. AWS is a high-quality profit pool that throws off cash to fund Amazon’s other bets and is itself still scaling. Mercado Pago is the engine, but it is also part of what is driving MELI’s debt buildup, because the credit book is expanding faster than revenue and needs regulatory capital. Garena is the highest quality cash flow on a margin and capital basis, almost no capex, very high EBITDA margin but it is mono-product. Free Fire generated $931.4M in bookings in Q1 2026. If Free Fire fades without a replacement, Garena’s cross-subsidy goes with it. So, AWS is the cleanest cross-subsidy. Mercado Pago is the cross-subsidy that also consumes capital. Garena is the highest-quality cross-subsidy that also carries the highest single-point-of-failure risk. That is a real difference.
Two verdicts fall out of this pillar that are worth stating directly. First, on free cash flow conversion. Garena as a standalone unit has the cleanest FCF conversion in the entire universe of the three, close to one-for-one EBITDA into cash, with essentially no capex line and no working capital draw. Nothing at Amazon or MELI prints at that quality on a segment basis. The catch is that Sea consolidated does not print at that quality, because SeaMoney’s $8.8B on-balance-sheet loan book absorbs every incremental dollar Garena and Shopee generate. That is why Sea’s FY2026 FCF-to-net-income ratio sits at 0.98x, below one. Amazon at the consolidated level converts EBITDA to FCF the most cleanly today, with AWS revenue growth running ahead of the AI capex depreciation wave so far. MELI’s consolidated conversion is structurally the weakest, because credit-book funding needs and regulatory capital sit between Mercado Pago’s accounting EBITDA and distributable cash. So segment-level Garena wins. Consolidated, Amazon wins today, Sea lags due to a finite cash drag, MELI lags due to a structural one.
Second, on reinvestment runway. Sea has the longest. Southeast Asia, Brazil and the rest of LatAm are all under-penetrated on digital commerce, on formal credit, and on advertising as a percent of GMV. Shopee at 52% SEA share is the leader, but the absolute revenue base is small. Gross margin is climbing from 28% to a projected 51% over the model window, that trajectory by itself signals years of monetization improvement before saturation. MELI is second. LatAm digital penetration still has years of compounding, plus banking licenses pending in Mexico and Argentina that unlock new product surface. Amazon’s geographic runway is the narrowest of the three because the developed-market e-commerce share is already mature in its core regions, but its dollar runway in AWS: AI workloads, Trainium, Bedrock, sovereign cloud, is wider in absolute terms than either MELI’s or Sea’s. The right read is: Sea has the longest runway in percentage terms, Amazon has the deepest in dollar terms, and MELI sits in between.
Advertising
Amazon’s ad business is now one of the larger ad businesses in the world. It’s growing at solid double-digit rates with very high operating margins. The data advantage is real. Amazon knows what people actually buy, not just what they browse for. Ads on Amazon convert at multiples of a comparable Google search ad. Prime Video ads close the funnel from the top to the bottom, with hundreds of millions of viewers globally on the ad-supported tier.
MELI’s Mercado Ads is the fastest-growing segment in the business. It’s growing north of 60% on an FX-neutral basis. Penetration as a percent of GMV is still well below where Amazon sits. If Mercado Ads scales toward Amazon-like penetration, you have a high-margin revenue stream that requires zero incremental logistics capex. Every dollar of ad revenue flows at very high EBITDA margins.
Shopee Ads is doing something even more aggressive in the short term. Ad revenue grew +80% year-over-year in Q1 2026. The ad take rate increased by more than 90 basis points in a single year. Sellers are paying more just to stay visible on the platform. The penetration story is the same as MELI’s. Ad revenue as a percent of GMV is still well below Amazon. The runway is wide. And like MELI’s, Shopee’s ads carry near-zero incremental cost. They flow straight to EBITDA. The only caveat is that Shopee’s pricing power comes almost entirely from merchants, not buyers. Buyers in Southeast Asia can move to Lazada or TikTok Shop in seconds. So, the ad take rate has to be earned against persistent merchant churn risk.
The point. All three have the same advertising flywheel mechanic, with Amazon at scale, MELI at a fraction of the scale and a multiple of the growth rate, and Sea at the steepest growth slope but also the steepest competitive intensity. This is one of the underappreciated pieces of both the MELI and SE theses. Part of Amazon’s own multi-year re-rating story was the market eventually learning to value AWS and advertising separately from the retail business. The same setup may exist with MELI and Sea today.
Logistics and Fulfillment
Amazon has built a fulfillment network with over a million robots in operation, well over a hundred billion dollars invested in infrastructure, and same-day delivery speeds that no other retailer can match without a decade-plus head start. Retail margins are still thin. Mid-single digits in North America. But the moat here is logistics scale, not pricing power.
Mercado Envios processes the majority of MELI’s shipments through owned fulfillment centers. They have dedicated aircraft. They have a last-mile fleet. It took them fifteen years to build, and billions of dollars. A new entrant can launch a website tomorrow. They can’t replicate this physical footprint in any reasonable time frame.
SPX Express, Shopee’s in-house network, now handles over 50% of Shopee orders. They have brought cost per order down roughly 20% year-over-year in rural areas. Two-hour delivery is live in select urban markets. The build-out is happening right now, and that is what’s hitting Shopee’s segment EBITDA: Fulfillment investment is the single largest line in management’s defense of compressed margins. Compared to MELI and Amazon, SPX is younger and smaller, but it is being financed without the AWS-style cross-subsidy. Garena helps. The SeaMoney capital draw works against it.
All three built logistics the same way. Aggressive capex. Thin retail margins. The infrastructure is in service of platform lock-in. The differences are the funding sources and the stages. Amazon has AWS paying for it and the build is mature. MELI is mid-build and financing it with debt. Sea is mid-build, financing it with Garena cash flow plus the same fintech-book capital strain that hits MELI.
Marketplace and Network Effects
For Amazon, the large majority of units sold come from third-party sellers. The economics are toll-road economics. Amazon collects fees on storage, shipping, and ads. Sellers are heavily locked in by their reviews and rankings.
MELI has the same third-party dynamic, but with a fintech overlay on top. Sellers don’t just sell on the marketplace. They get paid through Mercado Pago. They access credit through MELI’s lending arm. They advertise through Mercado Ads. If you’re engaged with all five services, the switching costs are functionally infinite. Amazon took fifteen years to build this kind of ecosystem in the US. MELI built it across eighteen countries.
Shopee has the same third-party dynamic and the same fintech overlay, plus a gaming-derived audience funnel on top. Shopee holds about 52% of the Southeast Asian e-commerce market, roughly $66.8B of GMV in early 2026. Take rates have been climbing. Effective takes in key markets reach the 10–20% range. The merchant lock-in is real. SPX integration. SeaMoney merchant credit. Ad placements. Same mechanic as MELI. The vulnerability is on the buyer side. Buyer switching cost in Southeast Asia is functionally zero, and TikTok Shop, holding about 18% with $22.6B in GMV, is growing at 40–55% against Shopee’s 25–30%. The marketplace lock-in is asymmetric: tight on merchants, loose on buyers. That is the structural difference between Shopee and the other two.
This is also the cleanest place to settle the pricing-power question across the three. Amazon has the highest pricing power, full stop. AWS holds gross margins in the cloud category that nobody else has matched at scale. Prime has raised price more than once with no material churn. Amazon’s ad slots clear at conversion rates that justify a meaningful premium to Google search on a per-impression basis. Across all three profit pools, cloud, subscription, advertising, Amazon’s pricing power is exercised on both sides of the marketplace and on enterprise customers. MELI’s pricing power is real but narrower in scope. It is leveraged on merchants through ad take rate, fulfillment fees and credit pricing, exactly the same merchant-side mechanic Sea uses, but applied to a more captive Latin American buyer base than Sea has in SEA. Mercado Pago can re-price credit on consumers in a way Mercado Libre cannot easily re-price commissions on buyers. Sea has the most asymmetric pricing power of the three. On merchants, it is the strongest in percentage terms: effective take rate at 10–20% in key markets, ad take rate up >90 basis points in a single year, ad revenue up +80%. That is pure pricing power being exercised on sellers who cannot leave the platform without losing scale. On buyers, Sea has effectively none. Shopee’s consumer is the most price-sensitive of the three. The first cheaper option wins. So the ranking is Amazon, then MELI, then Sea on overall pricing power. Sea wins on the narrower question of merchant pricing power, but loses on the broader question of full marketplace pricing power.
Subscription and Loyalty
Amazon Prime has well over a hundred million subscribers globally. The bundle includes shipping, video, music, gaming, and in some markets, healthcare. The reason Prime works is the math of the bundle. Cancelling Prime doesn’t lose you one app. It loses you the entire ecosystem of services in a single shot. Prime members shop roughly twice as often as non-members. Churn stays very low.
MELI’s Meli+ is earlier in its arc, but it follows the same bundling logic. And one thing worth flagging. The data MELI has on its users is arguably richer than what Amazon has, because MELI also has the financial profile. Credit usage. Repayment behavior. Savings patterns.
Sea is the furthest behind on a formal loyalty bundle. Shopee VIP exists. The cross-product hooks between Garena, Shopee and SeaMoney function as a de facto loyalty layer: a user buying Free Fire items through SeaMoney builds a credit history, then uses that credit on Shopee. That is loyalty by data and credit gravity rather than by subscription. The depth of cross-product data Sea has is arguably the richest of the three: gaming spend, retail spend, credit behavior in markets where formal credit bureaus barely exist. The package is not commercialized as a Prime-style bundle yet. That is both a gap and an option.
Six Questions, Six Direct Answers
Side-by-side financials only get you so far. The questions that actually matter are sharper. They’re about strategy, structural advantage, and where each business sits in its arc. Here are six that come up over and over, and direct answers to each.
Is Amazon now a value-plus story?
Value-plus, the way I’m using the term, means a value multiple paired with growth fundamentals. Amazon checks both boxes. The price-to-earnings multiple has come down meaningfully from its post-COVID peak. On EV-to-EBITDA, the stock trades at a discount to the rest of the mega-cap cohort. At the same time, gross margins are expanding. Operating margins are expanding. The AWS backlog is at multi-year highs. EPS growth has been solid. The balance sheet remains net cash positive. So, this isn’t a value trap. It’s more like a re-rating opportunity.
Here’s the asterisk. Forward EPS consensus has been conservative relative to what AWS AI monetization appears to be actually delivering. If you take consensus at face value, Amazon looks roughly fairly valued. If you think consensus is too low, which I’d argue is the right read given the AWS trajectory, Amazon is genuinely cheap on growth. The way I’d put the verdict. Value-plus, where the plus is a consensus-too-low setup that re-rates upward as each quarter prints and confirms the AI revenue ramp.
Will AWS AI revenue growth outpace the depreciation wave?
Probably yes. But tighter than the bull case would have you believe. And the answer depends on AWS holding 26% or better revenue growth.
Here’s the structural concern. Amazon’s planned 2026 capex is in the $200B range. The bulk goes to AI infrastructure. As that capex flows onto the balance sheet, it starts generating depreciation that hits the P&L over the useful life of the servers. And useful lives for AI silicon have been getting shorter as hardware cycles speed up. So depreciation per dollar of capex is higher than it was for traditional infrastructure builds. The risk is that depreciation rises faster than incremental AWS gross profit. That would mechanically compress AWS margins.
The offset is AWS revenue growth and operating leverage. The sensitivity of the math is easy to characterize. Per management disclosure, every 1% drop in AWS margins maps to roughly $1.4B in annual operating income. So the depreciation step-up needs to be more than offset by incremental gross profit from revenue growth. The threshold called out in the original research is around 26% AWS growth. At 26%+, incremental gross profit covers the depreciation step-up. Margins stay flat to rising. Below that, margins start to compress.
Why this matters. The commercial signals are real. Trainium 3 supply commitments are tight. Bedrock is growing fast. The OpenAI workload migration to AWS is a direct revenue driver. The backlog is at company highs. The case for sustained mid-twenties or better growth has support. But the math is tight. A quarter or two of deceleration would flip the answer. The verdict. Probably yes if AWS holds 26% or better growth. The answer flips to no if AWS prints sub-22% for a sustained period. This is the data point that matters most in any of the three names’ catalyst calendar, including, indirectly, MELI and Sea, because if AWS holds, the broader risk premium on the tech complex compresses, which is the rising tide both MELI and Sea need.
Can MELI hold its 30%+ growth streak? What about Sea Limited?
On revenue, yes for both. On earnings, no for both. And that gap is the entire problem for both stocks.
For MELI, revenue keeps printing in the 30%+ range on an FX-neutral basis. Mexico TPV growth runs materially higher than the corporate average. The credit book is roughly doubling annually. So, the top line is fine. The structural drivers are still in place. Latin American digital penetration. Banking licenses in process. Advertising scaling at multiples of corporate growth. 30%+ revenue growth is sustainable for several more years. Even bear-case DCF scenarios assume around 20% revenue CAGR, not a collapse. Earnings growth is a different conversation entirely. EPS has missed in most recent quarters. Realized full-year EPS growth dropped to roughly low single digits. That compares with a three-year CAGR that was well above 50%. The streak on the bottom line is over. It was broken by deliberate investment.
For Sea, the picture is similar with sharper edges. Revenue is accelerating, not decelerating. +46.6% year-over-year in Q1 2026 is the strongest top-line print of the three. Sea has beaten revenue estimates in every recent quarter. Then look at EPS. Sea has missed EPS estimates in 9 of the last 10 quarters. The estimated FY2026 EPS growth is roughly $0.28 on a +30% revenue print. So Sea is the cleanest example of the pattern. The top line is intact. The bottom line is structurally broken by deliberate reinvestment in Shopee fulfillment, the SeaMoney loan book growing at 71%, and a tax burden up 57% year-over-year in Q1.
So the market is asking the right question for both MELI and Sea. Can margins recover to the high teens or low twenties (MELI) or to management’s stated 2–3% Shopee EBITDA target plus a healthy SeaMoney spread (Sea)? Or has the combination of Amazon in Brazil, TikTok Shop in Southeast Asia, and Asian platform price war capped the recovery for good? The verdict. The top-line streak is intact for both. The bottom-line streak is broken for both. And the whole thesis on both names hangs on whether that break is cyclical, which is the capex digestion view, or structural, which is the competitive ceiling view.
This is also the right place to settle the quality-of-earnings question across the three. Amazon prints the highest quality earnings by a clear margin. AWS revenue is contracted, recurring, and tied to a multi-year backlog. Advertising revenue clears at high incremental margin. The retail segment is asset-heavy but the unit economics are stable and the accounting is conservative: capex flows to the balance sheet, depreciates predictably, and the FCF profile is recovering as the AI capex cycle peaks. No installment-receivable accounting. No fair-value gains running through the P&L on a credit book. EPS tracks economic earnings closely. MELI’s earnings quality is materially lower. A meaningful share of reported earnings comes from credit-book net interest income, which is high quality when defaults stay low but is mechanically inflated when the loan book grows fast and is exposed to mark-to-market and provisioning revisions when the cycle turns. Installment-receivable accounting also creates timing mismatches between booked revenue and realized cash. The 9-of-10 EPS misses at Sea actually go in the opposite direction: they are not earnings-quality issues, they are deliberate reinvestment and tax-rate effects, with Sea’s underlying gross margin expanding from 28% to a projected 51% across the model window. That is the inverse of earnings degradation. It is reinvestment compressing GAAP EPS while structural unit economics improve. The ranking is: Amazon’s earnings track economic reality the closest, Sea’s are deliberately suppressed by reinvestment but structurally improving underneath, MELI’s are the most accounting-driven and the most exposed to a credit-cycle revision.
Are MELI and Sea Limited spending offensively or defensively?
It’s a mix for both. And the mix is tilting defensive at MELI. At Sea it is more clearly offensive, but with a credit-book overlay that adds risk the other names do not have.
At MELI, the logistics buildout started well before Amazon Brazil. That’s offensive spending. Physical infrastructure that earns its return over a decade. Mercado Envios at majority in-house shipment penetration is an asset, not a subsidy. That’s not the controversial spending. The promotional spending is where the framing changes. Free shipping thresholds. First-party inventory ramps. Credit card subsidies for new cohorts. Cross-border trade investments. Management has put a number on it. They’ve called it 5–6 percentage points of margin drag, disclosed openly on the call. Here’s the timing detail that matters. The acceleration of this spending came in late 2025. Right alongside Amazon’s preparation for the Brazil entry. So a meaningful share of MELI’s spending is offensive moat-building. A non-trivial share is defensive, designed to protect share against Amazon, Shopee, Temu, and Shein. That defensive slice is what’s driving ROIC below WACC.
At Sea, the spending is more clearly weighted toward offence. Shopee fulfillment build-out. SeaMoney loan-book expansion. SPX Express deepening. Brazil entry. These are not Amazon-Brazil-style reactive subsidies, they are platform extensions that earn returns over a multi-year horizon. But Sea has a different exposure that MELI has more controlled. The SeaMoney loan book grew +71% year-over-year to $9.9B, with $8.8B sitting on the balance sheet. Every dollar of net new loans consumes free cash flow. That is what pushes Sea’s FY2026 FCF-to-net-income ratio to 0.98x, below 1x. So at Sea the right framing is not offensive-versus-defensive. It is offensive-but-cash-intensive. The cash drag is real. Whether it earns its return depends on NPLs holding around 1.1%, which they currently are, and on the loan book naturally decelerating below 30% growth from FY2027 onward, which management is implicitly guiding.
The verdict. MELI is building real moat, but a meaningful slice of the spending is reactive, and that slice is what decides whether the bear case or the base case plays out. Sea is also building real moat, more aggressively, but the cash conversion math depends on a fintech credit cycle that nobody has stress-tested yet.
Whose ecosystem moat is deepest in unbanked markets?
Different dimensions. But the honest answer is that fintech-plus-data is deeper than commercial cloud relationships, and gaming-plus-fintech-plus-data is the deepest of the three on a per-customer basis.
AWS has the wider moat in surface area. It runs hundreds of services. It has a large multi-year backlog. It has a head start on cloud infrastructure of roughly two decades. It has proprietary silicon, Graviton and Trainium. It has a leading developer ecosystem. To leave AWS, a mid-sized enterprise needs a migration that takes two to five years and costs tens of millions of dollars. The lock-in is real. But the customer relationship is purely commercial. In theory, they could build their own data center.
Mercado Pago’s moat is deeper in customer dependency. For hundreds of millions of underbanked Latin Americans, Mercado Pago is the first financial product they ever own. The first savings account. The first credit. The first card. That’s not just a switching-cost moat. That’s a primary financial relationship. By its nature, that kind of relationship sticks for far longer than a commercial or product-level relationship does.
Sea’s moat is structurally the same as MELI’s on the SeaMoney side: first financial product, primary financial relationship, in markets where traditional banking does not reach, but with one extra layer. SeaMoney prices credit using transaction data from Shopee and behavioural data from Garena. The model is reportedly more accurate than the traditional credit bureau in markets where the bureau is thin or non-existent. Loan book of $9.9B with NPL holding stable at 1.1%. Standalone fintech apps such as Grab do not have access to that volume of e-commerce or gaming data. So Sea has a moat that is structurally the same depth as MELI’s, on top of a data set that is arguably wider. The catch is duration. MELI has been compounding the financial relationship in Latin America for longer. Sea’s loan book is younger and has not been tested through a real credit cycle. NPLs at 1.1% are the print, and that print has not seen a recession.
Then there’s the regulatory dimension. AWS faces commercial competition. Mercado Pago, with full banking licenses pending in Mexico and Argentina, will eventually face regulated competition, which is much harder for new entrants to overcome. SeaMoney holds digital banking licenses in Singapore, Indonesia, Malaysia and the Philippines. Same regulatory moat logic, applied to a wider geographic footprint. The verdict. AWS has the wider moat in dollar terms. Mercado Pago has the deeper moat per customer in Latin America. SeaMoney has comparable per-customer depth across a more fragmented and earlier-stage geography, plus the gaming-data layer. Dollar for dollar of revenue, the fintech moats at both MELI and Sea are more valuable than the cloud moat. Sea’s is the most under-priced of the three.
In a high-rate macro, which model earns higher ROIC?
Amazon. By a clear margin. And the rate environment widens the gap, it does not narrow it. The interesting nuance is that Sea is structurally a notch above MELI on this question because of Garena’s cash generation, even though SE is unrated.
The framing matters. Amazon isn’t truly asset-light. The logistics infrastructure and the AI capex make that label misleading. But Amazon’s retail economics are asset-light, since the majority of units come from third-party sellers and the company operates on a toll-road fee structure. And AWS’s heavy assets are depreciable infrastructure with predictable economic lives. The risks to Amazon’s asset base are technological obsolescence and demand realization. Both are manageable. Neither is catastrophic. Amazon’s WACC sits in the roughly 10–11% range. The business generates returns above that on its core profit pools. AWS at around 35% operating margins. Advertising even higher.
MELI is doing something categorically different. It’s warehousing credit risk on its own balance sheet. That’s a different category of exposure. A multi-billion-dollar credit book that has roughly doubled in the past year. Funded partly by a corporate debt load that has grown several-fold over the same period. In a high-rate environment, two things happen at once. Cost of funding rises, so debt service expense goes up. And credit losses rise, because defaults correlate with rates. MELI’s own 10-K disclosed that installment payments fell more than a full percentage point of TPV due to rate sensitivity. MELI’s ROIC has fallen to roughly 2.4–3.6%. Their estimated WACC is 13–15%. Which means the business is currently destroying economic value on incremental capital. By their own admission.
Sea is also warehousing credit risk on its own balance sheet: an $8.8B book held on Sea’s books. The same category of exposure as MELI. The differences are in scale, in macro exposure, and crucially, in cross-subsidy. Sea’s loan book is roughly half the size of MELI’s relative to revenue mix, and Sea has Garena producing pure-margin gaming EBITDA against which the lending capital draw can be funded. ROIC at Sea sits around 9%, recovering from deeply negative just three years ago. WACC is in the 11% range. So Sea is also destroying economic value on incremental capital at this moment, but by a smaller margin than MELI, and with a clearer line of sight to ROIC crossing WACC by the late 2020s as the loan book matures and Shopee margins recover toward management’s 2–3% EBITDA target. The further wrinkle: Sea has no public credit rating. MELI sits at BB+. That gap matters for refinancing flexibility and funding cost, and it widens in a rate stress.
Amazon’s trailing ROE comes in around 5%, but that number is depressed by the AI capex cycle. It’s not a steady-state read. When capex normalizes, returns recover toward the underlying business economics, which are healthy. MELI’s compression is happening for a different reason. The credit book and physical infrastructure investments are pre-revenue. The funding costs hit today. The returns are deferred. Sea sits between the two: a credit book like MELI’s, plus a high-margin cash engine like Amazon’s. So when you rank the three model structures, a service business with depreciable infrastructure beats a hybrid retail-plus-credit business with a gaming cross-subsidy, which beats a retail-plus-credit business funded primarily by debt, in a rising-rate world, every single time. The verdict. Amazon’s ROIC profile is the highest quality of the three. Sea is second on a forward basis. MELI’s is the most pressured today. The gap widens in a high-rate macro. The MELI and SE bull cases both need one of two things. Either the macro and rates cooperate, or the credit book matures into profitability fast enough to flip the ROIC math. Neither is the obvious base case from here.
The closely related question is which of the three can survive sustained high inflation and a full business cycle without the thesis breaking. The answer ranks the same way as ROIC, but with sharper edges. Amazon is the only one of the three you can hold through a hard recession without rewriting the model. Net cash on the balance sheet despite the AI capex cycle. Investment-grade rating. AWS revenue contracted on multi-year terms that do not reset with the cycle. Prime is a defensive subscription. Even international retail at near-break-even can be flexed without P&L damage. Inflation actually helps a marketplace operator on the take-rate line, because nominal GMV rises faster than the cost base. MELI is the most exposed of the three to a credit cycle. Half the moat is a loan book funded partly by corporate debt at LatAm rates. MELI’s own 10-K disclosed installment TPV dropping more than a full percentage point on rate sensitivity. A hard cycle compounds three problems at once: defaults rise, cost of funding rises, and consumer discretionary spend on the marketplace slows. The combination is what would force a structural re-rate downward rather than a cyclical one. Sea sits between the two on cycle exposure but with a unique defensive feature. The Garena cash engine is counter-cyclical or at least cycle-neutral. Gaming spend in emerging markets tends to be resilient in mild downturns: basic-smartphone economics, sub-dollar microtransactions, and the entertainment substitution effect. So even if Shopee margins compress in a cycle and SeaMoney NPLs rise from 1.1% toward 3–4%, Garena is still throwing off close to pure-margin cash. The catch is that Sea is unrated, which raises refinancing risk in a stressed funding environment in a way that does not apply to Amazon or MELI. So the ranking on cycle and inflation survival: Amazon clearly first, with no caveats. Sea second, with Garena as the cushion and the unrated balance sheet as the offset. MELI third, with the credit book as the structural exposure that compounds in a high-rate stress.
Capex Cycle Inversion, Now Three-Way
If you take one thing from this comparison, it should be the inversion of the investment cycle. That’s the framing that pulls everything together. With Sea added to the picture, it stops being a two-stock cycle and starts looking like a three-stock relay.
Here’s Amazon’s recent arc, going forward. Capex sat at all-time highs as the AI infrastructure buildout peaked. Free cash flow was temporarily compressed. Debt rose meaningfully. Large bond offerings were absorbed by markets. The market hated this through much of 2024 and into early 2025. Now look at where we are. Margins are expanding. The post-COVID multiple de-rating is mostly done. The AI thesis is starting to validate, in the form of accelerating AWS revenue and Bedrock-driven workload migration. So, Amazon is exiting the painful phase.
MELI’s arc looks like the inverse. The investment cycle is just getting started. Capex is going into logistics, the credit book, and banking licenses. Debt has grown several-fold over the past six quarters. ROIC has fallen from a healthy mid-single-digit range down to a low-single-digit range, well below WACC. Net margin has halved. The multiple de-rating is underway, but it’s not finished. So MELI is entering the painful phase.
Sea sits in the middle of its own version of that arc, with an unusual signature. Revenue is accelerating, not slowing. Gross margins are expanding structurally. Adjusted EBITDA crossed $1B for the first time in Q1 2026. ROIC has already moved from deeply negative through low single digits to ~9%, which is roughly where Amazon’s own multi-year recovery from past capex troughs took it. But cash conversion has dropped to 0.98x because the SeaMoney loan book is absorbing every incremental dollar. The stock is down 56% from the September 2025 peak. So Sea is mid-cycle: past the worst of the operating loss years, past the EBITDA inflection, but right inside the cash drag from the fintech build. The multiple de-rate has already happened — SE trades at 14.7x EV/EBITDA, a 35% discount to MELI’s 22.5x. The painful phase is partly priced. The recovery phase is not.
If you believed in Amazon during its own painful capex-cycle troughs, when capex was eating cash flow and the narrative was that the AI buildout might never pay back, the setup for MELI and Sea today looks remarkably similar. Same playbook. Same investment-cycle pain. Same debate about whether the margin compression is cyclical or structural. The difference is that MELI is entering that phase while Sea is somewhere in the middle of it, with a different cash-engine profile.
Here’s the difference that matters. Amazon had AWS through its capex cycle. AWS kept compounding through the pain. MELI’s equivalent is Mercado Pago. And Mercado Pago is larger as a share of MELI’s profit pool than AWS was for Amazon at the same point in Amazon’s cycle. But Mercado Pago is also more capital-intensive, because lending requires balance sheet. And it doesn’t enjoy AWS-like margins yet. Sea’s equivalent is the pairing of Garena plus SeaMoney. Garena alone throws off close to $2.3B in EBITDA at near-pure-margin economics. That is more pristine cash flow per dollar of revenue than either AWS or Mercado Pago at the same stage. The catch is concentration risk. Garena is essentially Free Fire. Lose the game franchise, lose the cross-subsidy. So the pattern recognition is real for both MELI and Sea. But the cross-subsidy quality is highest at Amazon, lowest at MELI, and at Sea you get the cleanest margins paired with the highest single-product risk.
Risk Asymmetry: Three Direct-Competition Angles
Here’s what separates this matchup from a generic e-commerce comparison. The three names are now in direct competition along three distinct fronts.
Amazon Now’s launch in Brazil is the inflection point for the AMZN-MELI front. The sell-side downgrade activity that followed was explicitly about that competitive dynamic, not about any execution failure at MELI. The asymmetry of that conflict is worth thinking through. For Amazon, Brazil is a rounding error. Even meaningful share gains in Brazil don’t move the Amazon P&L in any material way. International retail is already running at near-break-even operating margin. So Amazon can subsidize indefinitely. For MELI, the picture is completely different. Brazil is roughly half of revenue. Amazon doesn’t have to win in Brazil. Amazon just has to compress MELI’s marketplace margins, force defensive spending, and slow the path back to high-teens or low-twenties EBITDA margins. That’s enough to do real damage.
The second front is Sea against MELI, also in Brazil. Shopee is established as a credible third player in Brazilian e-commerce, with SeaMoney’s Brazilian loan book crossing the $1B mark. Sea does not need to win in Brazil either. It needs to keep extending presence in a market where MELI is the incumbent and where Amazon is now the new external pressure point. That puts MELI in the middle of a two-front engagement: Amazon Now from one direction, Shopee from another, both attacking the same margin pool. The current price action at MELI implicitly reflects this dynamic.
The third front is Sea against TikTok Shop in Southeast Asia, with Amazon and MELI both watching from outside. TikTok Shop holds roughly 18% of the regional market against Shopee’s 52%, and it is growing at 40–55% against Shopee’s 25–30%. The asymmetry there sits in TikTok’s favor on growth momentum, in Shopee’s favor on order economics: Shopee’s average order value is $13–15 versus TikTok Shop’s $4.50–6. TikTok Shop is an impulse-buying social commerce channel. Shopee is a planned-purchase marketplace. They are not directly substitutable yet, but they share a buyer pool. The competitive intensity is what’s forcing Shopee’s defensive spend on shipping subsidies, which is the larger of the two factors compressing Shopee EBITDA today. Amazon Brazil and TikTok Shop SEA are both, in effect, the same pressure mechanic: external entrants forcing the incumbent to defend share with cash.
So the asymmetry sits clearly in Amazon’s favor on every competitive front it has chosen to engage. The bear case for MELI assumes Amazon’s Brazil push permanently caps the margin recovery. The bear case for Sea assumes TikTok Shop’s SEA push permanently caps Shopee’s path to its 2–3% EBITDA target. The bull cases argue a few things. That Amazon’s Brazil scale-up will take years. That TikTok Shop’s order-economics gap to Shopee is structural. That MELI’s and Sea’s ecosystem moats, which are fintech plus credit plus logistics plus, in Sea’s case, gaming, are much harder to replicate than groceries or impulse social commerce. That local data advantages compound. And that cross-border Asian platform competition is a bigger systemic risk than any one rival.
All of these views can be true at the same time. Which is exactly why both MELI and SE are trading near the bear case.
Bottom Line
Pulling the six questions together. Amazon is a value-plus story with growing fundamentals. The AWS AI ramp is likely to outpace depreciation if it holds 26% or better growth. And it has higher and more durable ROIC than either MELI or Sea Limited in the current rate environment. MELI’s revenue streak is intact. The earnings streak is not. The central question, whether the margin compression is cyclical or structural, is what every subsequent quarter is now testing. Sea’s revenue streak is the strongest of the three at +46.6%. The earnings streak is broken in the same way as MELI’s, plus Sea has the additional fintech-cash-drag overlay that MELI has been working through for longer.
On the moat comparison, the answer is now three-dimensional. AWS has the widest commercial moat. Mercado Pago has the deepest per-customer financial relationship in Latin America. SeaMoney has comparable per-customer depth in Southeast Asia paired with the unique gaming-data layer through Garena. All three are durable. The capex question, offensive versus defensive, is tilting defensive at MELI right now, more clearly offensive at Sea, and largely resolved at Amazon. That mix is the part most likely to determine which valuation scenario plays out for MELI and Sea.
If you had to pick one for a 12-month hold, Amazon still offers the cleanest asymmetry. Capex peak is behind. AWS is reaccelerating. AI workloads are ramping. The fundamental story is intact. The balance sheet can’t break in a recession. So, Amazon is the higher-ROIC, lower-volatility ride.
MELI is the higher-conviction, higher-volatility setup. Priced at bear case. The vast majority of simulated outcomes sit above the current price. Sum-of-the-parts at a substantial discount. Mercado Pago is undervalued versus pure-play fintech comparables, in a way that parallels how AWS was once undervalued inside Amazon before the market learned to value it separately. A deeper moat per dollar of revenue, waiting to be recognized. But the MELI case requires four things to land. That the margin compression is cyclical, not structural. That Amazon Brazil is contained. That the credit book matures without a defaults spike. And that the rate environment cooperates.
Sea is the highest-volatility, highest-asymmetry of the three. Down 56% from the peak. Trading at $87.28 against a base-case DCF target of $110 and a sum-of-the-parts target of $114. Monte Carlo probability-weighted mean at $120 implies +38% upside. The market is paying for Shopee and getting SeaMoney plus Garena for free, in the same way it once paid for Amazon retail and got AWS for free. The 35% EV/EBITDA discount to MELI is the cleanest mispricing of the three names. The SE case requires five things to land, one more than MELI. That Shopee EBITDA margin actually recovers toward management’s 2–3% target. That SeaMoney loan growth decelerates below 30% so cash conversion mechanically improves. That NPLs hold around 1.1%, untested through a real credit cycle. That Garena does not roll over while Free Fire is still the single point of dependence. And that TikTok Shop’s growth in SEA does not force a permanent shipping-subsidy regime. That’s five conditions. Most of them need to land. Insider selling has been heavy and systematic across the C-suite from March through May 2026, which is the data point most at odds with the bull case and worth taking seriously.
Amazon’s higher ROIC and balance sheet resilience anchor the position. MELI’s optionality and depth-of-moat advantage in fintech provide one asymmetric upside leg. Sea provides the second, with a different geographic exposure, a fundamentally different cash-engine profile in Garena, and a cleaner valuation discount on EV/EBITDA. They hedge each other on the central question, which is whether the emerging-market investment cycles resolve favorably. And they are correlated on the underlying flywheel mechanics that make all three worth owning in the first place.
From here forward, watch four numbers. AWS revenue growth, which needs to hold around 26% or better for the depreciation math to work cleanly. MELI’s EBITDA margin trajectory, which needs a visible inflection to validate the cyclical-not-structural read. Sea’s Shopee segment EBITDA margin, which needs to print a clear recovery toward the 2–3% target. And the SeaMoney NPL ratio, which needs to hold around 1.1% as the loan book matures. Those four trajectories, tracked over the next several quarters, will decide where all three stocks sit by year-end. Everything else is noise.
Disclaimer
This report is provided strictly for informational purposes and does not constitute financial advice, an offer to sell, or a solicitation to purchase any securities. The author may hold a position in securities discussed. The analysis reflects independent research conducted without external compensation or existing business relationships with the mentioned entities. Please be advised that investing involves significant risk, and past performance is never a guarantee of future market results. Readers should conduct their own due diligence or consult a licensed professional before making any investment decisions based on this data. All information is sourced from public filings and is considered current only as of the date of May 22, 2026.
Join the Value & Momentum Portfolio
Elevate your investment process with institutional-grade equity research. Subscribe to unlock our weekly Macro & Market Pulse, alongside high-conviction momentum setups. We specialize in fundamental deep dives across AI Infrastructure, SaaS, and Defense. Gain a definitive data edge with our weekly intelligence sweeps, featuring: tracking of sell-side upgrades and rising price targets, insider and institutional fund flows, aggressive options activity (calls sweeping the ask), and proprietary second-derivative growth analysis by sector.
Get the edge you need, led by former investment banker Denis D (Lazard, Rothschild). Our research helps you stay ahead of the curve. Subscribe to start your analysis now.
Great work. Provides excellent insight into the issues.
Fascinating work, that explanation of how SeaMoney and MercadoPago differ is really interesting for understanding the consumers and growth potential. I have stayed away from Sea mostly because I didn’t fully grasp the value of the gaming part of the business so I really appreciate this analysis.