
The Invisible Distribution
What the smart money did while the tape looked calm


The surface of the market looks calm. Indexes near their highs. Tech leading. Most people feeling a lot better than they did back in March.
But underneath that calm, something else was happening in May. Millennium cut its gross long exposure by more than $15 billion. The Gates Foundation sold its entire $3.4 billion stake in Microsoft. Pershing Square dumped $1.6 billion of Google. Lisa Su sold $55.7 million of her own AMD stock. And somebody paid more than $10 million for long-dated puts on AMD.
The rally was real. Nobody can argue with that. But here’s the case I want to lay out today. The most sophisticated money in the market used every tick of that rally to get out.
And then, because this matters just as much, I’m going to spend a good chunk of this article arguing against my own thesis. Because the difference between analysis and storytelling is whether you’re willing to do that.
“Sell”
Let me start with what this is. It’s a piece of data synthesis. It pulls from four separate channels, and all four are public, or close to it.
Short volume, from FINRA. Unusual options flow, from OPRA. Insider sales, from SEC Form 4 filings. And big institutional position changes, from 13-F filings. The window is May 1st through June 3rd, 2026.
Now, two ground rules before we go further.
First: for every seller, there’s a buyer. The market clears. Every share that Millennium sold, someone else bought. So “big names are selling” is never, by itself, the signal because big names are always selling something. The real questions are narrower. Is the selling unusual relative to its own history? Is it clustered in the same places across independent channels? And is the buyer on the other side weaker and later? That’s the bar this has to clear.
Second: I’m working from data that I’d want to verify against the primary filings before betting real money on it. Treat the specific numbers as a starting point, not gospel. The framework is what matters, and the framework holds regardless of whether any single figure is off by a bit.
With that said, let’s start with the shorts.
Short Volume & Microstructure
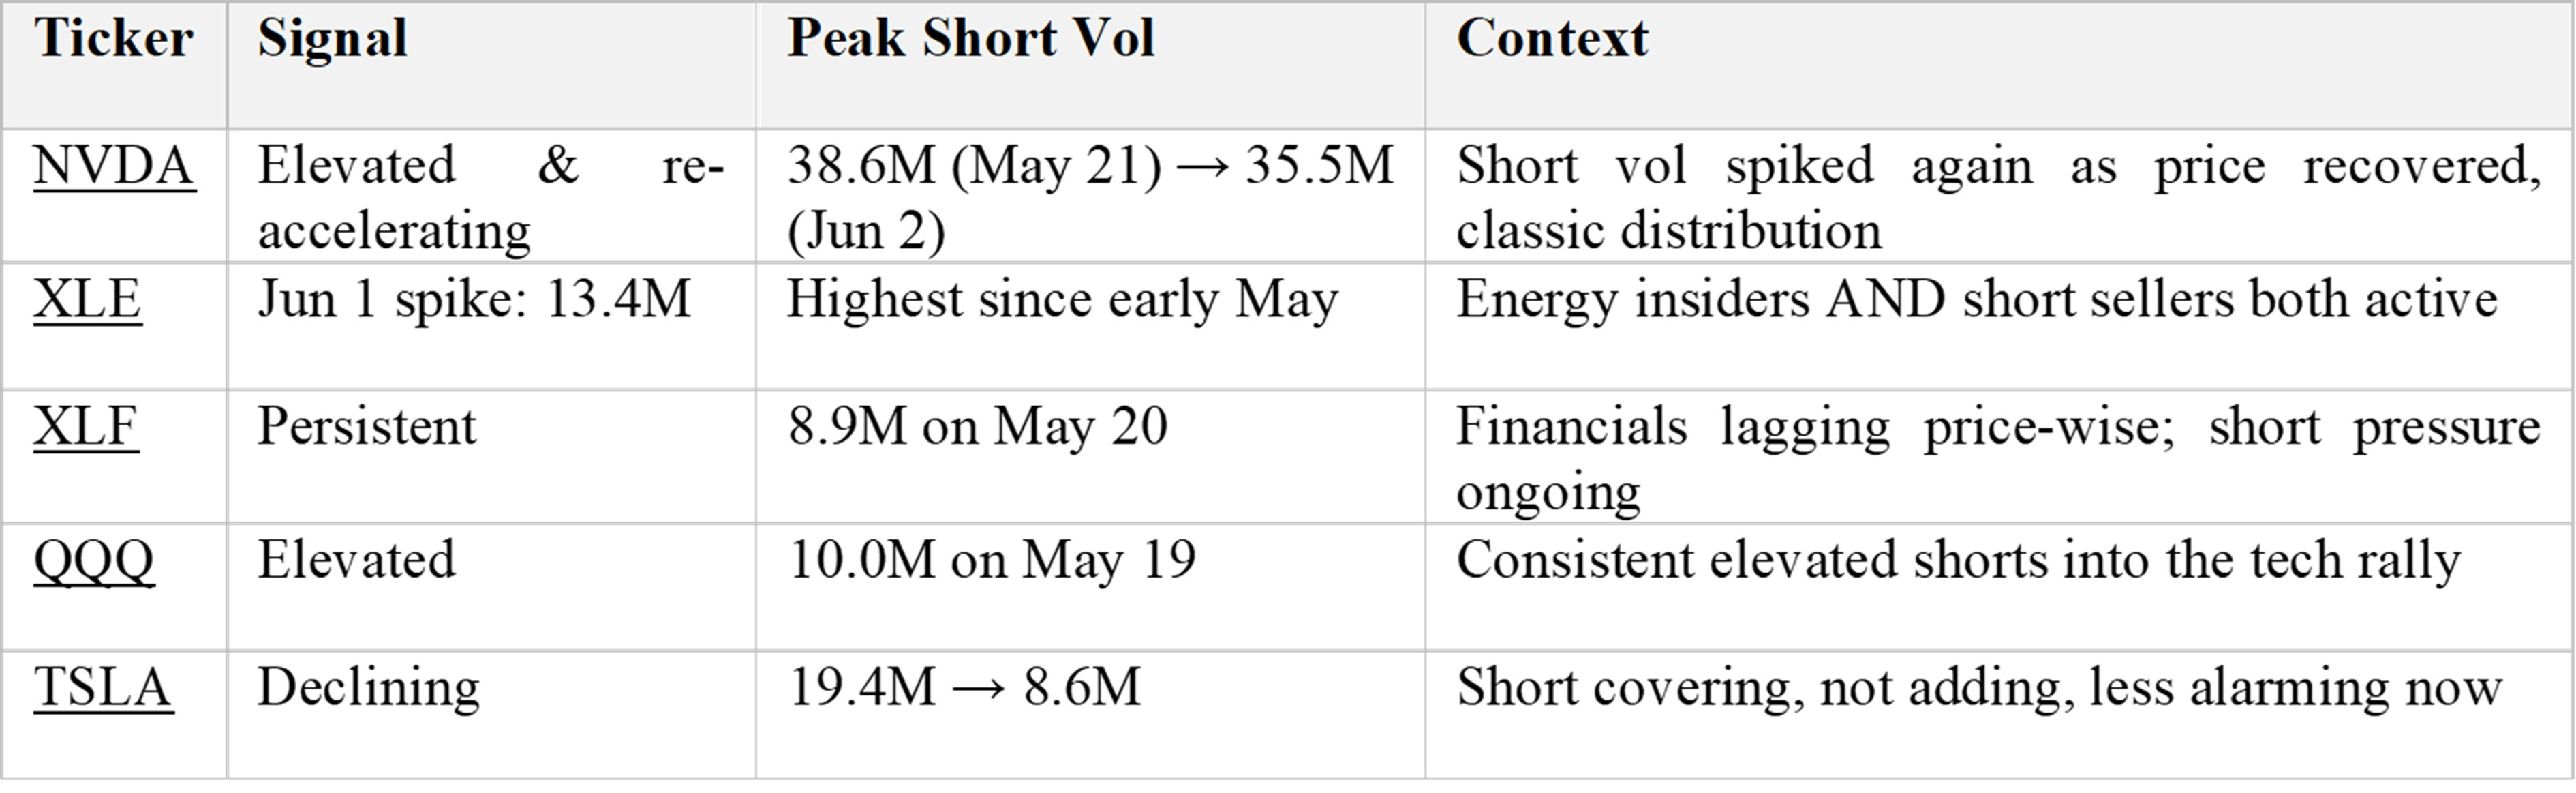
Short volume tells you how hard traders are betting against a name. And the standout here is Nvidia.
Nvidia’s short volume hit 38.6 million shares on May 21st. It eased off, then re-accelerated, back up to 35.5 million by June 2nd. Here’s why that matters. The shorts didn’t pile in when the stock was falling. They re-loaded as the price recovered to new highs. That’s the textbook signature of distribution. Selling pressure that gets heavier, not lighter, as the price climbs.
Compare that to Tesla. Tesla’s short volume fell from 19.4 million shares down to 8.6 million. That’s covering. Traders closing bets, not adding. So, Tesla is actually less alarming here, not more.
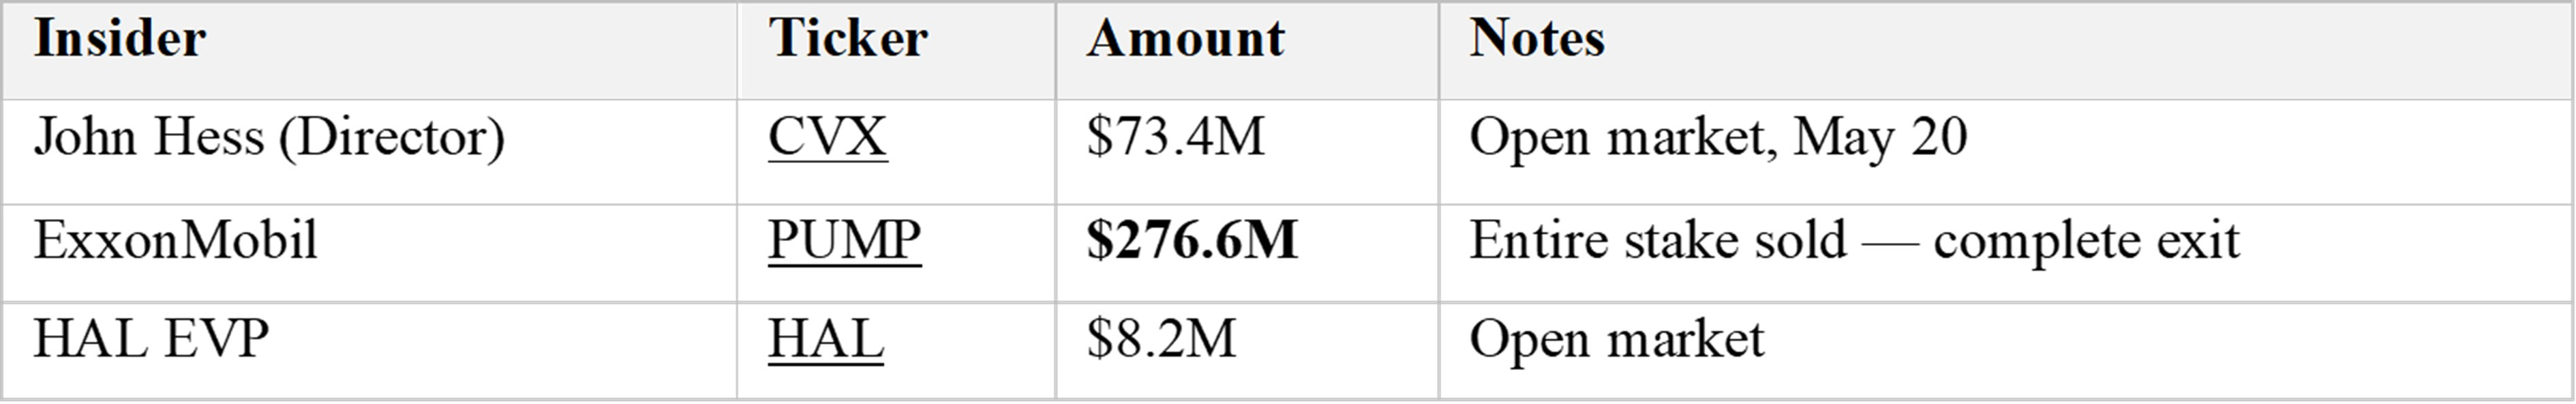
The energy ETF, XLE, spiked to 13.4 million shares of short volume on June 1st, its highest since early May. And the financials ETF, XLF, showed persistent short pressure, with QQQ elevated right through the rally.
So, the read is clean. The pressure is concentrated, and it’s heaviest where the price is highest.
Unusual Options Flow
Now the options. This is where it gets specific.
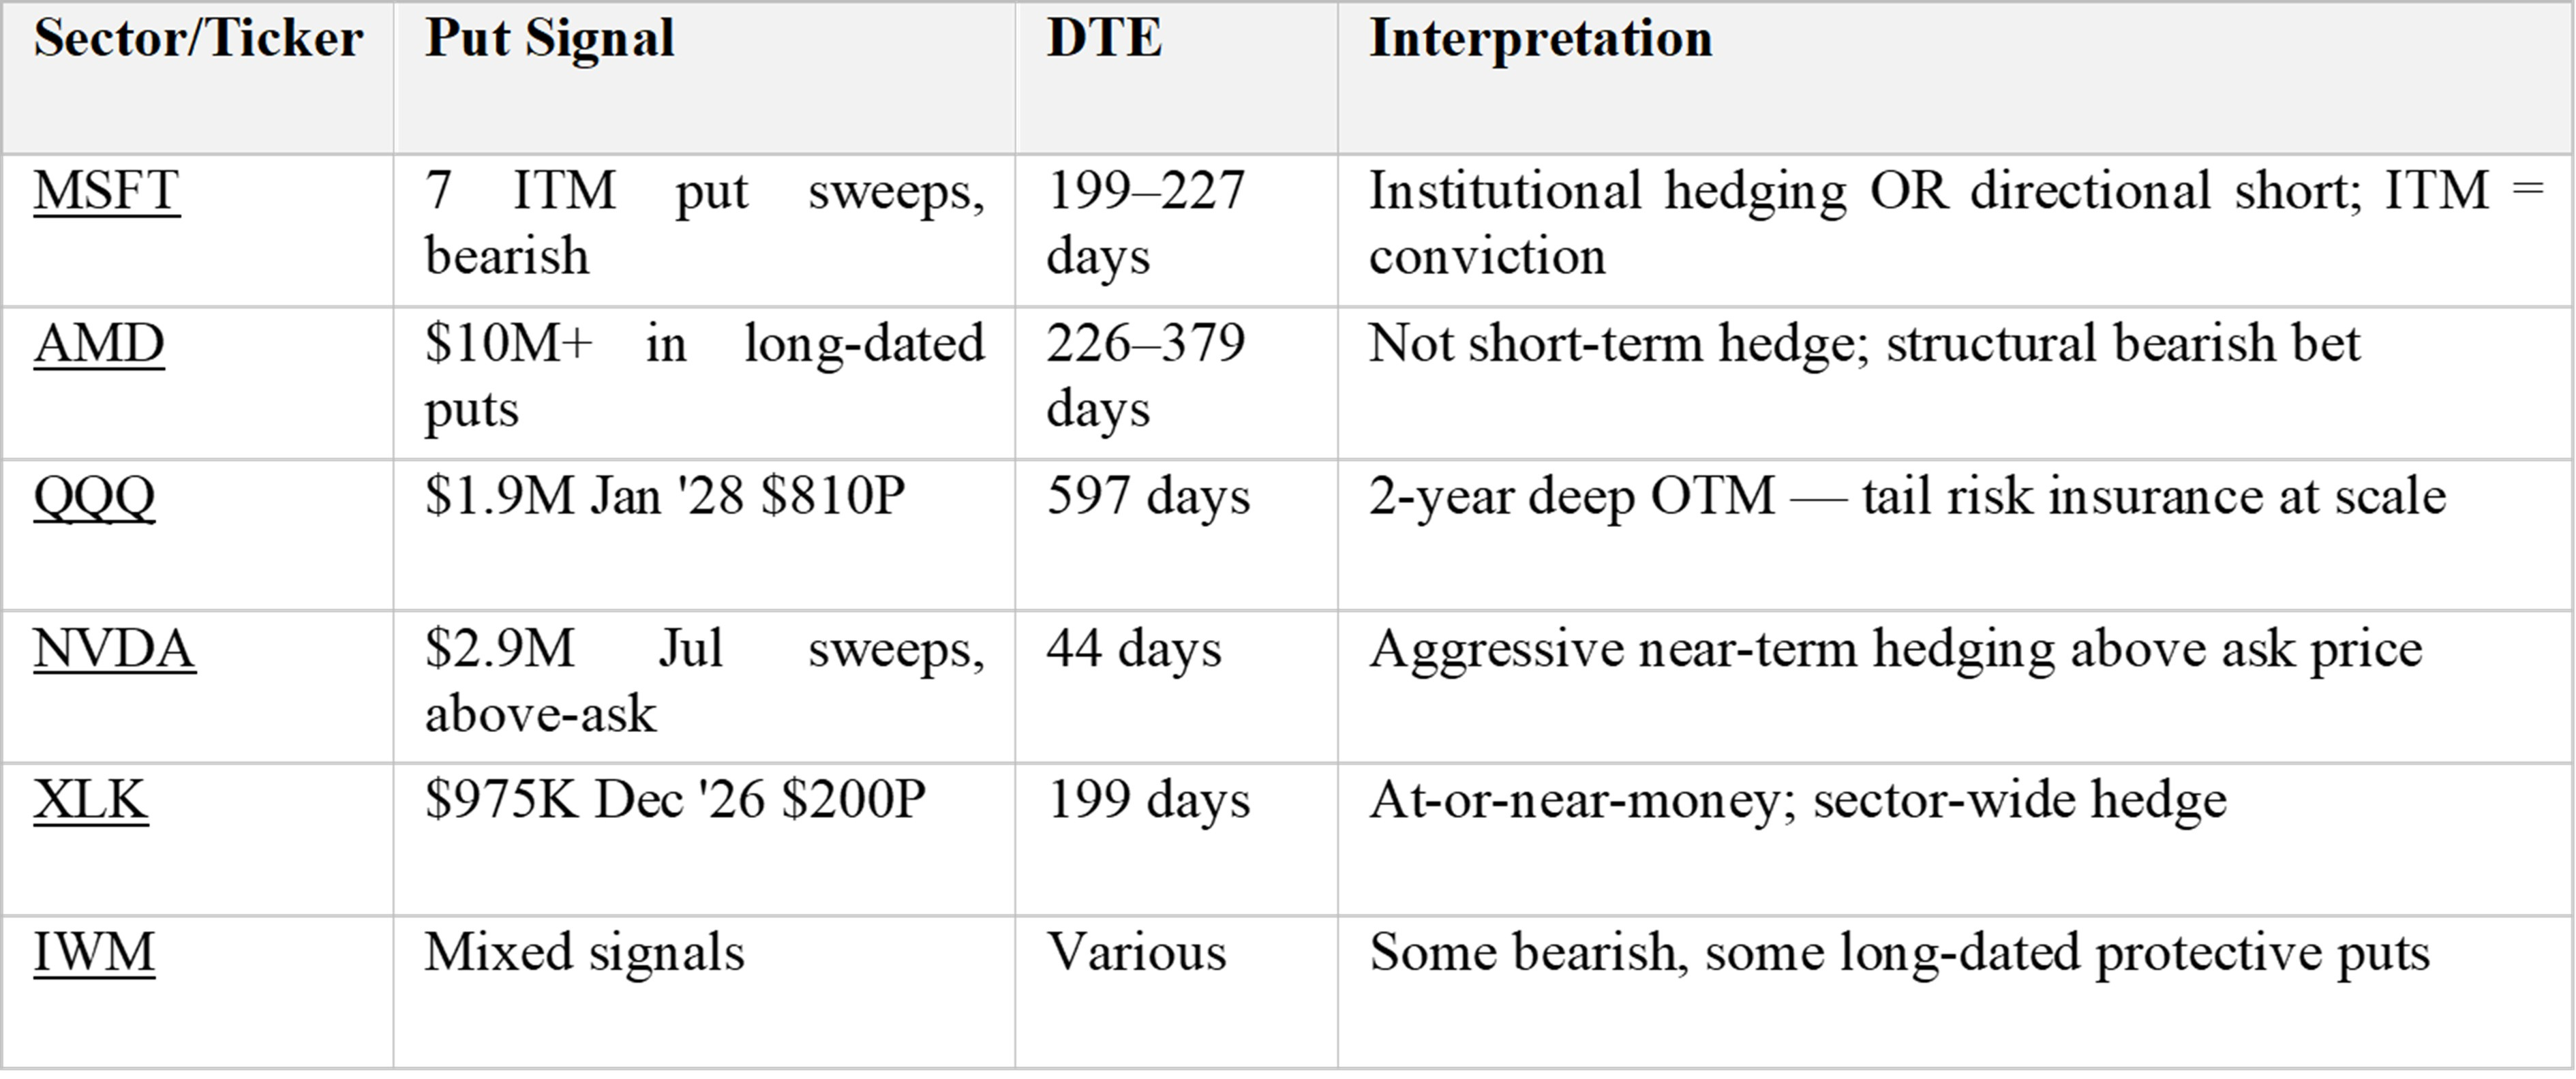
The single most striking data point of the month was Microsoft. On June 1st, seven separate put sweeps went through, strikes between $645 and $675, expiring in December and January of next year. All marked bearish. All executed at the ask.
Here’s the detail that matters. Microsoft was trading around $425 to $460 at the time. So those puts were deep in the money. Someone paid up to own in-the-money downside protection, in size. You don’t do that to hedge casually. That’s positioning consistent with someone who expects the stock to fall, and soon enough for it to count.
And it wasn’t just Microsoft. More than $10 million of premium sat in long-dated AMD puts, out six months and beyond. There were aggressive near-term sweeps on Nvidia. And the one I keep coming back to: somebody paid $1.9 million for a January 2028 put on QQQ, struck at $810, when the index was at $744. That position only pays off if the Nasdaq is below $810, a level it’s already under, almost two years from now. Read it the other way: they wrote a check that says the Nasdaq goes nowhere, or lower, for two years.
Insiders & Institutions Selling
The people who run these companies, and what they did with their own stock.
It clustered hard in technology. Lisa Su, the CEO of AMD, sold $55.7 million on May 13th. Alex Karp, the CEO of Palantir, sold $54.1 million the same day two other Palantir insiders sold $43.5 million and $22.5 million. Frank Slootman, a director at Snowflake, sold more than $228 million across consecutive days. The single largest transaction in the whole dataset, $750 million came from the Viessmann family at Carrier.
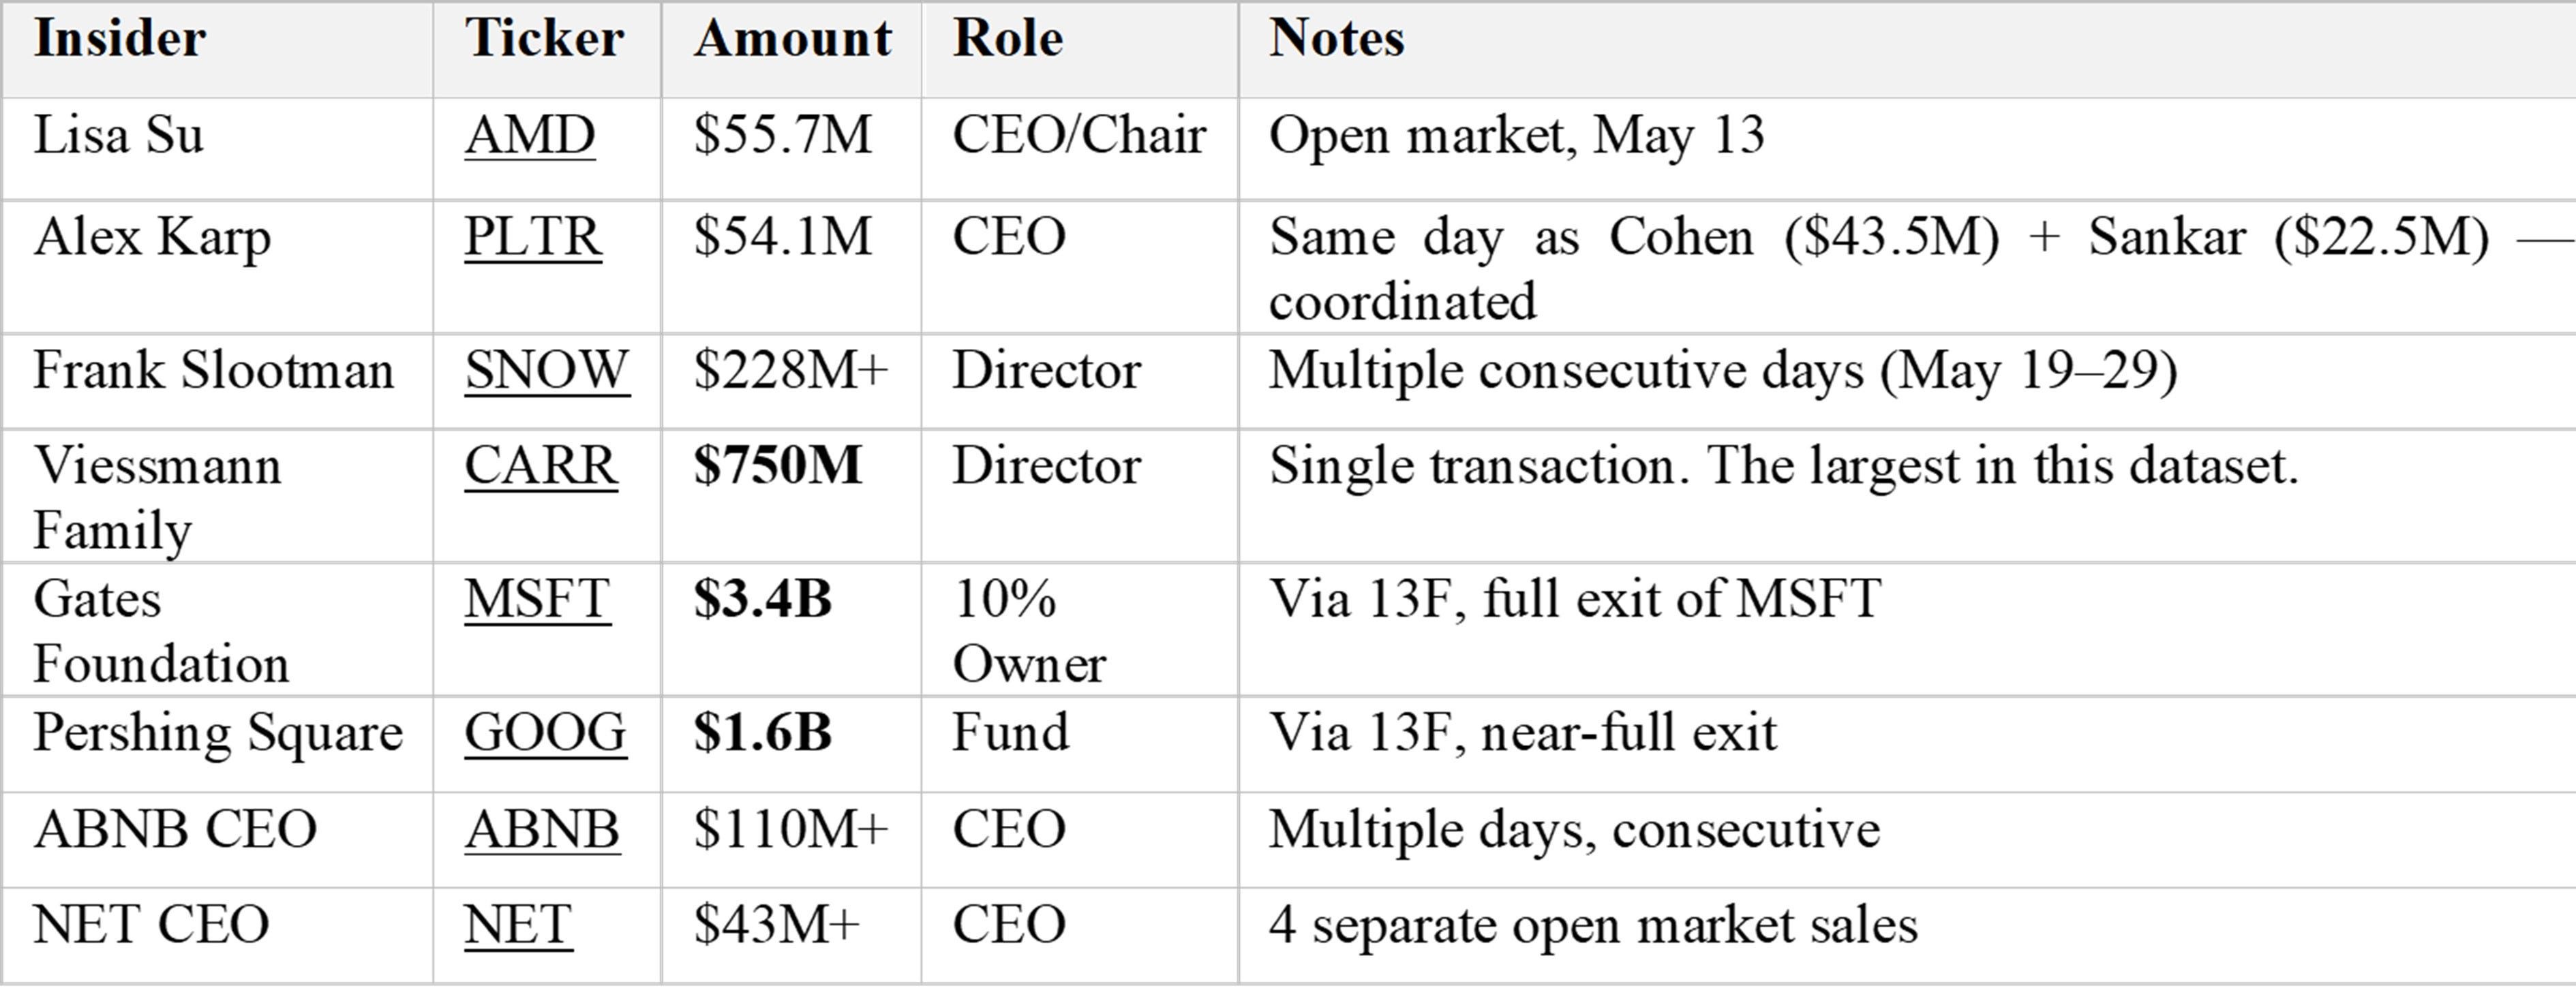
Then the patient money heading for the exits. A full Gates Foundation exit of $3.4 billion in Microsoft. A near-full Pershing Square exit of $1.6 billion in Google. And one striking anomaly: the CEO of United Therapeutics, Martine Rothblatt, sold $5.4 million every single trading day for fourteen straight days.
Add it up and one number stands out: about 62% of all insider sale dollars in this window came from technology, AI, and software.
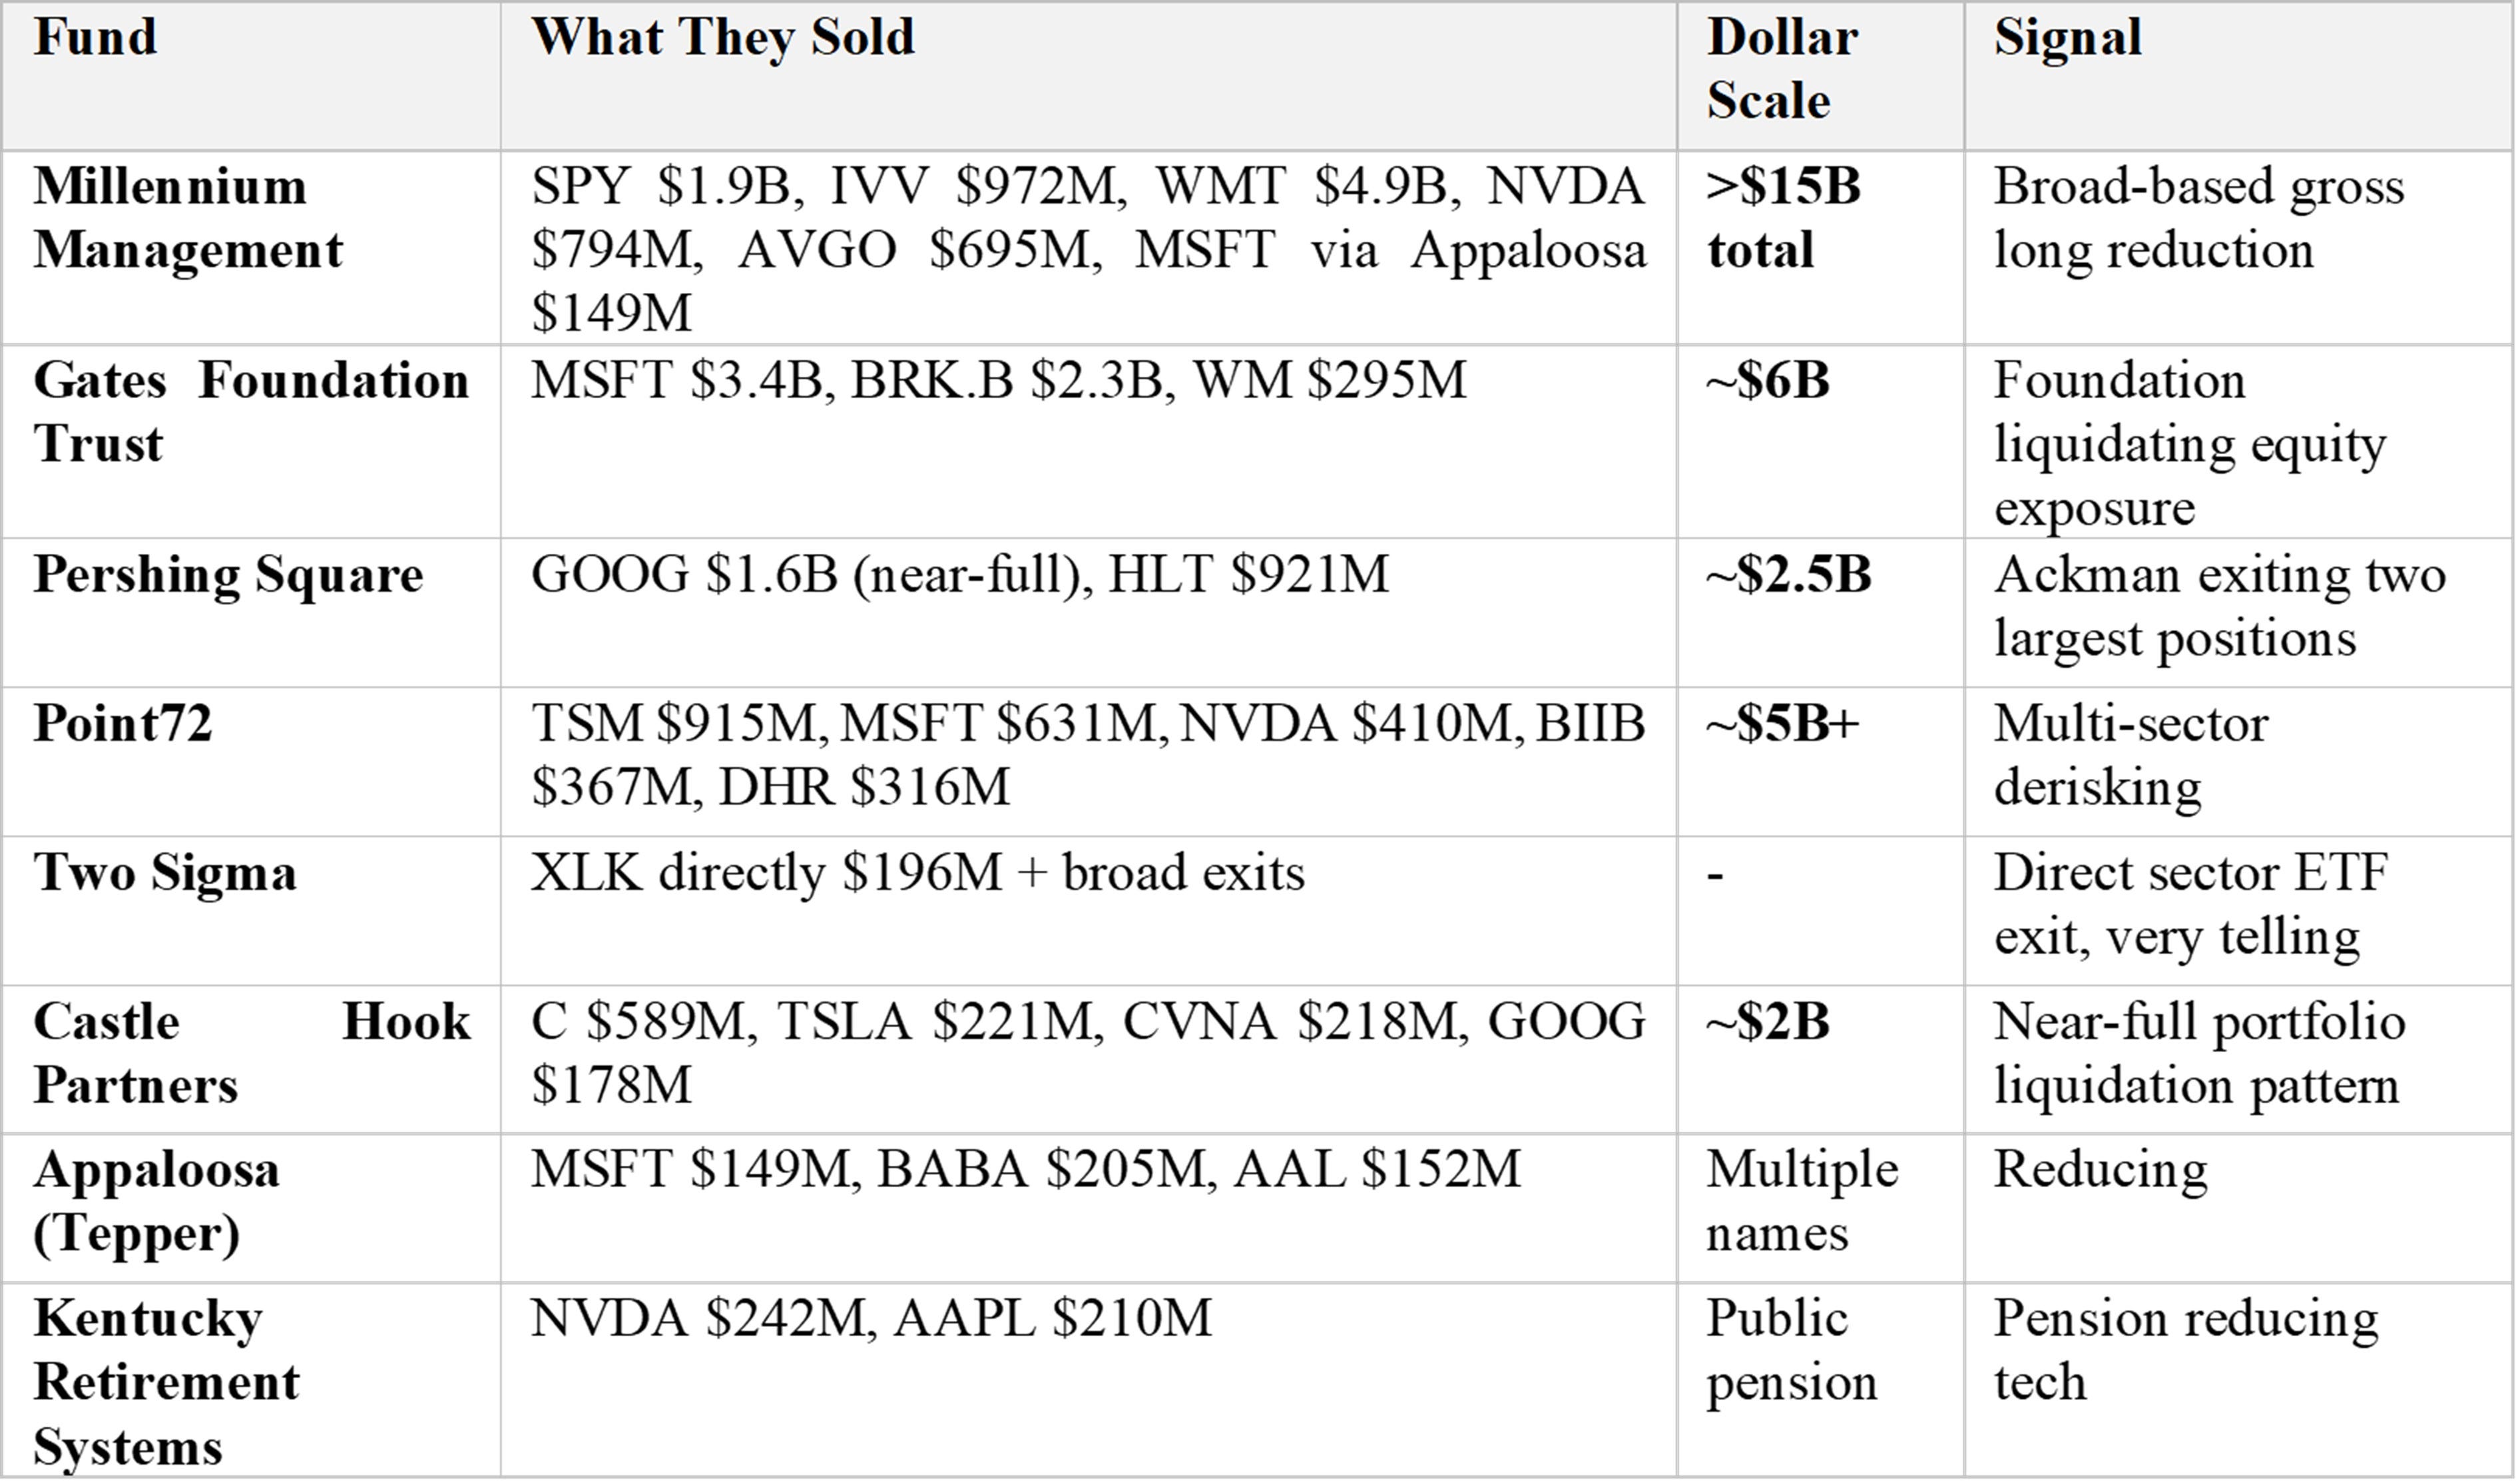
And the 13-Fs confirm it from the top down. Millennium cut more than $15 billion of gross long exposure in a single filing. The Gates Foundation Trust cut about $6 billion. Pershing Square, about $2.5 billion. Point72, around $5 billion. And the quants told the same story: Two Sigma sold the tech ETF, XLK, directly.
Underneath the indexes, the price action is the tell. From the March lows, XLK ran up about 51% in twelve weeks, and institutions sold into every tick. Energy went nowhere while the S&P rose about 16%. And financials rose just 4% against that same 16%. That last one matters most. Financials almost always lead a real bull market. Up 16 on the index, up 4 on the banks; that’s a non-confirmation.
So that’s the footprint. Now here’s where most Substack newsletters stop. And here’s where the actual work begins.
Now let me argue with myself
